Search Results for
Products
 |
Air TemperatureThe Air Temperature map plots the current air temperature (degrees F) at the standard height of 1.5 m (5 feet). When temperatures are below freezing, a line will delineate the… |
 |
Today's Maximum & Minimum Air TemperaturesToday's Maximum & Minimum Air Temperatures map plots the maximum and minimum temperatures (degrees F) recorded at each Mesonet station since midnight. This map is updated every 5 minutes. |
 |
Yesterday's Maximum & Minimum Air TemperaturesYesterday's Maximum & Minimum Air Temperatures map plots the maximum and minimum temperatures (degrees F) recorded at each Mesonet on the previous day. |
 |
Maximum/Minimum Air Temperature DifferenceThe Maximum/Minimum Air Temperature Difference map plots two values for each Mesonet station:
|
 |
3-hour Air Temperature ChangeThe 3-hour Air Temperature Change map plots the change in temperature (degrees F) at each Mesonet station over the past 3 hours. This map is updated every 5 minutes. |
 |
24-hour Air Temperature ChangeThe 24-hour Air Temperature Change map plots the change in temperature (degrees F) at each Mesonet station over the past 24 hours. This map is updated every 5 minutes. |
 |
Current ConditionsThe Current Conditions map displays:
|
 |
Wind Speed and DirectionThe Wind Speed and Direction map displays the average wind speeds (in miles per hour) at 10 m (33 feet) across Oklahoma. Arrows indicate the average direction the wind is… |
 |
Today's RainfallToday's Rainfall map displays accumulated rainfall observed at each Mesonet site since midnight. This map also displays the NWS Arkansas-Red Basin River Forecast Center's rainfall estimates (in color) across… |
 |
Inversion ConditionsThe Inversion Conditions map displays:
|
 |
Dewpoint TemperatureThe Dewpoint Temperature map displays the current dewpoint temperature (degrees F) observed at each Mesonet site. Dewpoint is the temperature to which air must be cooled for saturation to occur… |
 |
3-hour Dewpoint Temperature ChangeThe 3-hour Dewpoint Temperature Change map plots the change in dewpoint temperature (degrees F) at each Mesonet station over the past 3 hours. This map is updated every 5 minutes. |
 |
24-hour Dewpoint Temperature ChangeThe 24-hour Dewpoint Temperature Change map plots the change in dewpoint temperature (degrees F) at each Mesonet station over the past 24 hours. This map is updated every 5 minutes. |
 |
Moisture ConvergenceThe Moisture Convergence map displays areas where wind and moisture converge or diverge across the state. Areas of moisture convergence represent locations favorable for the development of surface-based thunderstorms. |
 |
1-day Average 2-inch Fractional Water IndexThe 1-day Average 2-inch Fractional Water Index map displays the 24-hour-averaged soil moisture at 2 inches (5 cm) under native sod for the previous day. Fractional water index ranges from… |
 |
1-day Average 10-inch Fractional Water IndexThe 1-day Average 10-inch Fractional Water Index map displays the 24-hour-averaged soil moisture at 10 inches (25 cm) under native sod for the previous day. Fractional water index ranges from… |
 |
Hours Below Freezing in the last 48 HoursThe Hours Below Freezing in the Last 48 Hours map displays the total number of hours each Mesonet site recorded temperatures of 32 degrees F or less in the past… |
 |
1-hour Rainfall AccumulationThe 1-hour Rainfall Accumulation map displays accumulated rainfall observed at each Mesonet site in the last hour. This map also displays the NWS Arkansas-Red Basin River Forecast Center's rainfall… |
 |
3-hour Rainfall AccumulationThe 3-hour Rainfall Accumulation map displays accumulated rainfall observed at each Mesonet site in the last 3 hours. This map also displays the NWS Arkansas-Red Basin River Forecast Center's… |
 |
6-hour Rainfall AccumulationThe 6-hour Rainfall Accumulation map displays accumulated rainfall observed at each Mesonet site in the last 6 hours. This map also displays the NWS Arkansas-Red Basin River Forecast Center's… |
 |
12-hour Rainfall AccumulationThe 12-hour Rainfall Accumulation map displays accumulated rainfall observed at each Mesonet site in the last 12 hours. This map also displays the NWS Arkansas-Red Basin River Forecast Center's… |
 |
24-hour Rainfall AccumulationThe 24-hour Rainfall Accumulation map displays accumulated rainfall observed at each Mesonet site in the last 24 hours. This map also displays the NWS Arkansas-Red Basin River Forecast Center's… |
 |
2-day Rainfall AccumulationThe 2-day Rainfall Accumulation map displays accumulated rainfall observed at each Mesonet site in the last 2 days. This map also displays the NWS Arkansas-Red Basin River Forecast Center's… |
 |
3-day Rainfall AccumulationThe 3-day Rainfall Accumulation map displays accumulated rainfall observed at each Mesonet site in the last 3 days. This map also displays the NWS Arkansas-Red Basin River Forecast Center's… |
 |
4-day Rainfall AccumulationThe 4-day Rainfall Accumulation map displays accumulated rainfall observed at each Mesonet site in the last 4 days. This map also displays the NWS Arkansas-Red Basin River Forecast Center's… |
 |
5-day Rainfall AccumulationThe 5-day Rainfall Accumulation map displays accumulated rainfall observed at each Mesonet site in the last 5 days. This map also displays the NWS Arkansas-Red Basin River Forecast Center's… |
 |
7-day Rainfall AccumulationThe 7-day Rainfall Accumulation map displays accumulated rainfall observed at each Mesonet site in the last 7 days. This map also displays the NWS Arkansas-Red Basin River Forecast Center's… |
 |
1-hour Maximum Wind GustsThe 1-hour Maximum Wind Gusts map displays the highest wind gust (in mph) recorded at each Mesonet station in the past hour. This map is updated every 5 minutes. |
 |
Today's Maximum Wind GustsToday's Maximum Wind Gusts map displays the highest wind gust (mph) recorded at each Mesonet station since midnight. This map is updated every 5 minutes. |
 |
Yesterday's Maximum Wind GustsYesterday's Maximum Wind Gusts map displays the highest wind speed (mph) recorded yesterday at each Mesonet station . |
 |
Mass ConvergenceMass convergence (and divergence) measured by the Oklahoma Mesonet indicates rising or sinking air near the ground at a particular location based on the change in wind speed over a… |
 |
2-inch Soil TemperatureThe 2-inch Soil Temperature map displays the current soil temperature (degrees F) at 2 inches (5 cm) under the existing vegetative cover at each Mesonet site. This map is updated… |
 |
4-inch Bare Soil TemperatureThe 4-inch Bare Soil Temperature map displays the current soil temperature (degrees F) at 4 inches (10 cm) under bare soil. This map is updated every 15 minutes. |
 |
4-inch Soil TemperatureThe 4-inch Soil Temperature map displays the current soil temperature (degrees F) at 4 inches (10 cm) under the existing vegetative cover at each Mesonet site. This map is updated… |
 |
1-day Average 2-inch Soil TemperatureThe 1-day Average 2-inch Soil Temperature map displays the 24-hour-averaged soil temperature (degrees F) at 2 inches (5 cm) under the existing vegetative cover at each Mesonet site for the… |
 |
1-day Average 4-inch Bare Soil TemperatureThe 1-day Average 4-inch Bare Soil Temperature map displays the 24-hour-averaged soil temperature (degrees F) at 4 inches (10 cm) under bare soil for the previous day. This map is… |
 |
1-day Average 4-inch Soil TemperatureThe 1-day Average 4-inch Soil Temperature map displays the 24-hour-averaged soil temperature (degrees F) at 4 inches (10 cm) under the existing vegetative cover at each Mesonet site for the… |
 |
3-day Average 2-inch Soil TemperatureThe 3-day Average 2-inch Soil Temperature map displays the 72-hour-averaged soil temperature (degrees F) at 2 inches (5 cm) under the existing vegetative cover at each Mesonet site for the… |
 |
3-day Average 4-inch Bare Soil TemperatureThe 3-day Average 4-inch Bare Soil Temperature map displays the 72-hour-averaged soil temperature (degrees F) at 4 inches (10 cm) under bare soil for the previous three days. This map… |
 |
3-day Average 4-inch Soil TemperatureThe 3-day Average 4-inch Soil Temperature map displays the 72-hour-averaged soil temperature (degrees F) at 4 inches (10 cm) under the existing vegetative cover at each Mesonet site for the… |
 |
1-day Average 24-inch Fractional Water IndexThe 1-day Average 24-inch Fractional Water Index map displays the 24-hour-averaged soil moisture at 24 inches (60 cm) under native sod for the previous day. Fractional water index ranges from… |
 |
Sea-Level Pressure (inches of Mercury)The Sea-Level Pressure map displays the current pressure, reduced to sea level, in inches of mercury. The pressure data are reduced to sea level because surface pressure is directly proportional… |
 |
3-hour Sea-Level Pressure Change (inches of Mercury)The 3-hour Sea-Level Pressure Change map displays the change in pressure at each Mesonet site (in inches of mercury) over the past three hours. This map is updated every five… |
 |
Solar RadiationThe Solar Radiation map displays the current solar radiation (in Watts per square meter) observed at each Mesonet station. This map is updated every five minutes. |
 |
Oklahoma City, OK |
 |
Tulsa, OK |
 |
Vance Air Force Base, OK |
 |
Frederick, OK |
 |
Recent Rainfall TableThe Rainfall Table lists the observed rainfall (inches) at each Mesonet station for the indicated time period. |
 |
Severe WindsThe Severe Winds product allows the user to search for severe wind reports in the Mesonet archives for the past 1 hour to 7 days. |
 |
Visible SatelliteThis visible satellite image is updated approximately every 15 minutes. |
 |
Water Vapor SatelliteThis water vapor satellite image is updated approximately every 15 minutes. |
 |
Oklahoma Infrared SatelliteThis Oklahoma satellite image displays one of the infrared (IR) channels of the GOES-East satellite (Channel 14). IR satellite images can show cloud coverage both during the daytime and nighttime.… |
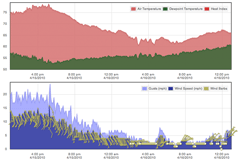 |
Station Meteograms |
 |
Station Monthly SummariesMonthly summaries are available for each Mesonet station. Data reflect measurements taken from midnight to midnight Central Standard Time (CST).
|
 |
Mesonet Data FilesData files can be provided on request by contacting datarequest@mesonet.org. Service fees may apply. Mesonet MDF and MTS files are space delimited files used to display data… |
 |
Daily Data RetrievalThe daily data retrieval allows users to create their own data files by selecting the dates, stations, and variables of interest. Small requests are output on the screen. Larger requests… |
 |
Dodge City, KS |
 |
Wichita, KS |
 |
Springfield, MO |
 |
Ft. Smith, AR |
 |
Little Rock, AR |
 |
Shreveport, LA |
 |
Dallas - Ft. Worth, TX |
 |
Dyess AFB, TX |
 |
Lubbock, TX |
 |
Amarillo, TX |
 |
Pueblo, CO |
 |
Today's Maximum Wind Chill / Heat IndexToday's Maximum Wind Chill / Heat Index map plots the highest "feels like" temperature at each Mesonet station. Thus, depending on the season, the map plots either:
|
 |
Today's Minimum Wind Chill / Heat IndexToday's Minimum Wind Chill / Heat Index map plots the lowest "feels like" temperature at each Mesonet station. Thus, depending on the season, the map plots either:
|
 |
Yesterday's Maximum Wind Chill / Heat IndexYesterday's Maximum Wind Chill / Heat Index map plots the highest "feels like" temperature at each Mesonet station. Thus, depending on the season, the map plots either:
|
 |
Yesterday's Minimum Wind Chill / Heat IndexYesterday's Minimum Wind Chill / Heat Index map plots the lowest "feels like" temperature at each Mesonet station. Thus, depending on the season, the map plots either:
|
 |
Hours Below Freezing in the Last WeekThe Hours Below Freezing in the Last Week map displays the total number of hours each Mesonet site recorded temperatures of 32 degrees F or less in the past week.… |
 |
Consecutive Hours Below FreezingThe Consecutive Hours Below Freezing map displays the total number of consecutive hours each Mesonet site has recorded a temperature of 32 degrees F or less. If the number of… |
 |
9-meter Air TemperatureThe 9-meter Air Temperature map plots the current air temperature (degrees F) at the height of 9 m (29.5 feet). This map is updated every 5 minutes. |
 |
Relative HumidityThe Relative Humidity map displays the current relative humidity (%) at each Mesonet site. Relative Humidity is the measure of the water vapor content of the air at a given… |
 |
Theta-EThe Theta-E map displays the equivalent potential temperature at each Mesonet station in degrees Kelvin. Theta-E is a quantity that indicates the stability of the atmosphere, or the available energy… |
 |
Dewpoint DepressionThe Dewpoint Depression map displays the difference (degrees Fahrenheit) between the air temperature and the dewpoint temperature. This map is updated every 5 minutes. |
 |
Wet-Bulb TemperatureThe Wet-Bulb Temperature map displays the temperature the air would have if it cooled to saturation by evaporation (given a constant pressure). Lower wet bulb temperatures in the summer mean… |
 |
Wind Speed & Gusts, with BarbsThe Wind Speed and Gusts, with Barbs map displays the current wind speeds (in mph) at each Mesonet site. The wind barb is an "arrow" that depicts the wind speed… |
 |
Wind Speed & Gusts, with ArrowsThe Wind Speed and Gusts, with Arrows map displays the current wind speeds (in mph) at each Mesonet site. Arrows indicate the wind direction at each station. Wind gusts are… |
 |
Wind Chill / Heat IndexThis Wind Chill / Heat Index map plots either:
|
 |
WeatherScopeDescription***Note: The final version of WeatherScope was released on November 17, 2014. WeatherScope is no longer operationally supported by the Oklahoma Mesonet.*** Use our WeatherScope software to create interactive… |
 |
10-day Rainfall AccumulationThe 10-day Rainfall Accumulation map displays accumulated rainfall observed at each Mesonet site in the last 10 days. This map also displays the NWS Arkansas-Red Basin River Forecast Center's… |
 |
30-day Rainfall AccumulationThe 30-day Rainfall Accumulation map displays accumulated rainfall observed at each Mesonet site in the last 30 days. This map also displays the NWS Arkansas-Red Basin River Forecast Center's… |
 |
Current Fire Weather ConditionsThe Current Fire Weather Conditions map displays:
|
 |
Today's Maximum Air TemperaturesToday's Maximum Air Temperatures map plots the maximum temperature (degrees F) recorded at each Mesonet station since midnight. This map is updated every 5 minutes. |
 |
Today's Minimum Air TemperaturesToday's Minimum Air Temperatures map plots the minimum temperatures (degrees F) recorded at each Mesonet station since midnight. This map is updated every 5 minutes. |
 |
Yesterday's Maximum Air TemperaturesYesterday's Maximum Air Temperatures map plots the maximum temperatures (degrees F) recorded at each Mesonet on the previous day. |
 |
Yesterday's Minimum Air TemperaturesYesterday's Minimum Air Temperatures map plots the minimum temperatures (degrees F) recorded at each Mesonet on the previous day. |
 |
Cattle Comfort Conditions |
 |
Peanut Leaf Spot Advisor |
 |
Pecan Scab |
 |
Spinach White Rust |
 |
Burning IndexThe Burning Index (BI) value (10*feet) as calculated by the Oklahoma Fire Danger Model. This is probably the most useful index of the National Fire Danger Rating System (on which… |
 |
500 mb PlotThe 500 millibar (mb) map plots a variety of information collected by weather balloons and represents atmospheric conditions at an altitude of approximately 5500 meters (18,000 feet). The map displays… |
 |
850 mb PlotThe 850 millibar (mb) map plots a variety of information collected by weather balloons and represents atmospheric conditions at an altitude of approximately 1500 meters (5,000 feet). The map displays… |
 |
300 mb PlotThe 300 millibar (mb) map plots a variety of information collected by weather balloons and represents atmospheric conditions at an altitude of approximately 9300 meters (30,000 feet). The map displays… |
 |
National Air TemperatureThe Air Temperature map plots the current air temperature (degrees F) at the standard height of 1.5 m (5 feet). This map is updated every hour using data from NOAA's… |
 |
National Wind Chill / Heat IndexThis Wind Chill / Heat Index map plots either:
|
 |
National Altimeter SettingThis map is updated every hour using data from NOAA's National Weather Service. |
 |
National Dewpoint TemperatureThe Dewpoint Temperature map displays the current dewpoint temperature (degrees F) observed at each National Weather Service site. Dewpoint is the temperature to which air must be cooled for saturation… |
 |
National Relative HumidityThe Relative Humidity map displays the current relative humidity (%) at each National Weather Service site. Relative Humidity is the measure of the water vapor content of the air at… |
 |
National Wind SpeedThe WInd Speed map plots the current wind speeds (miles per hour) at the standard height of 10 m (30 feet). This map is updated every hour using data from… |
 |
National Fire Weather AdvisoriesThis map displays the latest fire advisories for the United States. It is updated as advisories are issued by the National Weather Service. |
 |
National Flood AdvisoriesThis map displays the latest flood advisories for the United States. It is updated as advisories are issued by the National Weather Service. |
 |
National Frost/Freeze AdvisoriesThis map displays the latest frost and freeze advisories for the United States. It is updated as advisories are issued by the National Weather Service. |
 |
National Heat AdvisoriesThis map displays the latest heat advisories for the United States. It is updated as advisories are issued by the National Weather Service. |
 |
National Severe Weather AdvisoriesThis map displays the latest severe weather advisories for the United States. It is updated as advisories are issued by the National Weather Service. |
 |
National High Wind AdvisoriesThis map displays the latest high wind advisories for the United States. It is updated as advisories are issued by the National Weather Service. |
 |
National Winter Storm AdvisoriesThis map displays the latest winter weather advisories for the United States. It is updated as advisories are issued by the National Weather Service. |
 |
Oklahoma Severe Weather AdvisoriesThis map displays the latest severe weather advisories for Oklahoma. It is updated as advisories are issued by the National Weather Service. |
 |
National Ice AdvisoriesThis map displays the latest ice advisories for the United States. It is updated as advisories are issued by the National Weather Service. |
 |
Oklahoma Fire AdvisoriesThis map displays the latest fire advisories for Oklahoma. It is updated as advisories are issued by the National Weather Service. |
 |
Oklahoma Flood AdvisoriesThis map displays the latest flood advisories for Oklahoma. It is updated as advisories are issued by the National Weather Service. |
 |
Oklahoma High Wind AdvisoriesThis map displays the latest high wind advisories for Oklahoma. It is updated as advisories are issued by the National Weather Service. |
 |
Oklahoma Heat AdvisoriesThis map displays the latest heat advisories for Oklahoma. It is updated as advisories are issued by the National Weather Service. |
 |
Oklahoma Winter Storm AdvisoriesThis map displays the latest winter storm advisories for Oklahoma. It is updated as advisories are issued by the National Weather Service. |
 |
Oklahoma Frost/Freeze AdvisoriesThis map displays the latest frost and freeze advisories for Oklahoma. It is updated as advisories are issued by the National Weather Service. |
 |
Oklahoma Ice AdvisoriesThis map displays the latest ice advisories for Oklahoma. It is updated as advisories are issued by the National Weather Service. |
 |
1-hour Dewpoint Temperature ChangeThe 1-hour Dewpoint Temperature Change map plots the change in dewpoint temperature (degrees F) at each Mesonet station over the past 1 hour. This map is updated every 5 minutes. |
 |
National RadarThe above map is a composite of all radars across the United States. The unit dBZ is a measure of the radar reflectivity factor, which indicates the intensity of the… |
 |
Oklahoma Visibility AdvisoriesThis map displays the latest visibility advisories for Oklahoma. It is updated as advisories are issued by the National Weather Service. |
 |
National Visibility AdvisoriesThis map displays the latest visibility advisories for the United States. It is updated as advisories are issued by the National Weather Service. |
 |
National Ocean AdvisoriesThis map displays the latest advisories for the oceans around the United States. It is updated as advisories are issued by the National Weather Service. |
 |
Consecutive Days with Less than 0.10 inches RainfallDuring precipitation events involving ice, sleet, or snow, the rain gauges used by the Oklahoma Mesonet may freeze over and record no rainfall. Once air temperatures raise enough to allow… |
 |
Consecutive Days with Less than 0.25 inches RainfallDuring precipitation events involving ice, sleet, or snow, the rain gauges used by the Oklahoma Mesonet may freeze over and record no rainfall. Once air temperatures raise enough to allow… |
 |
7-day 10-inch Fractional Water Index ChangeThe 7-day 10-inch Fractional Water Index Change map displays the change in soil moisture at 10 inches (25 cm) over the past week Positive numbers indicate an increase in soil… |
 |
Days with Maximum Air Temperature Above 100°FThe Days with Maximum Air Temperature Above 100°F map displays the number of days this year when the maximum air temperature was at or above 100°F. This map is updated… |
 |
Days with Maximum Air Temperature Above 90°FThe Days with Maximum Air Temperatures Above 90°F map displays the number of days this year when the maximum air temperature was at or above 90°F. This map is updated… |
 |
Consecutive Days with Maximum Air Temperature Above 90°FThe Consecutive Days with Maximum Air Temperature Above 90°F map displays the number of consecutive days (through yesterday) when the maximum air temperature was at or above 90°F. This map… |
 |
Days with Maximum Air Temperature Below 32°FThe Days with Maximum Air Temperature Below 32°F map displays the number of days this winter when the maximum air temperature was at or below freezing. This map is updated… |
 |
Days with Minimum Air Temperature Below 32°FThe Days with Minimum Air Temperature Below 32°F map displays the number of days this winter when the minimum air temperature was at or below freezing. This map is updated… |
 |
Consecutive Days with Maximum Air Temperature Below FreezingThe Consecutive Days with Maximum Air Temperature Below Freezing map displays the number of consecutive days (through yesterday) when maximum air temperature was at or below freezing. This map is… |
 |
Consecutive Days with Minimum Air Temperature Below FreezingThe Consecutive Days with Minimum Air Temperature Below Freezing map displays the number of consecutive days (through yesterday) when the minimum air temperature was at or below freezing. This map… |
 |
Total Daily Solar Radiation (megajoules per square meter)The Total Daily Solar Radiation map displays the integrated solar radiation (MJ/m^2) for each Mesonet station for the previous day. This map is updated each night. |
 |
Monthly Rainfall Table |
 |
Mesonet Long-Term Averages - MapsThe Mesonet long-term averages utilize 15 years of daily data (e.g. daily average, daily maximum/minimum, or daily total) for every current and past Oklahoma Mesonet station. For a station's data… |
Regional Weather Tables |
|
Black Rot Spray Advisor |
|
Season-long Risk Days Map |
|
Season-long Risk Days Table |
|
 |
6 to 10 Day Precipitation OutlookThe 6-10 day Outlook gives the confidence (probability) that the National Weather Service has that the observed total precipitation, averaged over upcoming days 6, 7, 8, 9 and 10 will… |
 |
6 to 10 Day Temperature OutlookThe 6-10 day Outlook gives the confidence (probability) that the National Weather Service has that the observed temperature, averaged over upcoming days 6, 7, 8, 9 and 10 will be… |
 |
8 to 14 Day Precipitation OutlookThe 8-14 day Outlook gives the confidence (probability) that the National Weather Service has that the observed total precipitation, averaged over upcoming days 8, 9, 10 , 11, 12, 13,… |
 |
8 to 14 Day Temperature OutlookThe 8-14 day Outlook gives the confidence (probability) that the National Weather Service has that the observed temperature, averaged over upcoming days 8, 9, 10, 11, 12, 13, and 14… |
NWS Forecast TemperatureThe forecast temperature map plots the predicted air temperatures (degrees F) for Oklahoma. This map is updated periodically throughout the day. These forecasts are provided by the National Weather Service.… |
|
 |
US Seasonal Drought OutlookThe U.S. Seasonal Drought Outlook is produced by the National Weather Service's Climate Prediction Center. The outlook is updated every 2 weeks. |
 |
3-7 Day National Hazard OutlookThe 3-7 Day National Hazard Outlook is produced by the National Weather Service's Weather Prediction Center. |
 |
3-hour Humidity ChangeThe 3-hour Humidity Change map plots the change in relative humidity at each Mesonet station over the past 3 hours. This map is updated every 5 minutes. |
 |
24-hour Humidity ChangeThe 24-hour Humidity Change map plots the change in relative humidity at each Mesonet station over the past 24 hours. This map is updated every 5 minutes. |
 |
2-meter Wind SpeedsThe Gradient-Filled Wind Map displays the average wind speeds (in miles per hour) across Oklahoma at 2 meters (6 feet) above the surface. Arrows indicate the average direction the wind… |
 |
Dispersion ConditionsDispersion condition categories indicate the ability of the atmosphere to dilute airborne particles (i.e. smoke, pollution, pesticides). Atmospheric dispersion includes both horizontal and vertical dilution of released vapor-like particulates. The… |
 |
8-14 Day National Hazard OutlookThe 8-14 Day National Hazard Outlook is produced by the National Weather Service's Climate Prediction Center. |
 |
National Visible SatelliteThis national satellite image displays the visible channel of the GOES-East satellite (Channel 2). During the daytime this map is useful for seeing clouds as well as features such as… |
 |
National Infrared SatelliteThis national satellite image displays one of the infrared (IR) channels of the GOES-East satellite (Channel 14). IR satellite images can show cloud coverage both during the daytime and nighttime.… |
 |
National Water Vapor SatelliteThis national satellite image displays the mid-level water vapor channel of the GOES-East satellite (Channel 9), which is typically at a pressure level around 500 millibars (approximately 18,000 feet). This… |
 |
Oklahoma RadarThe above map is a composite of all radars in Oklahoma. When temperatures are below freezing, a line will delineate the areas of the state that are above and below… |
 |
1-day Average 4-inch Plant Available WaterThe 1-day Average 4-inch Plant Available Water map is based on the 24-hour-averaged plant available water for the top 4 inches (10 cm) of soil under the existing vegetation at… |
 |
1-day Average 16-inch Plant Available WaterThe 1-day Average 16-inch Plant Available Water map is based on the 24-hour-averaged plant available water for the top 16 inches (40 cm) of soil under the existing vegetation at… |
 |
1-day Average 32-inch Plant Available WaterThe 1-day Average 32-inch Plant Available Water map is based on the 24-hour-averaged plant available water for the top 32 inches (80 cm) of soil under the existing vegetation at… |
 |
Day 1 Convective Storm OutlookThe day 1 severe weather outlook is issued by the National Weather Service's Storm Prediction Center. |
 |
Day 2 Convective Storm OutlookThe Day 2 severe weather outlook is issued by the National Weather Service's Storm Prediction Center. |
 |
Day 3 Convective Storm OutlookThe day 3 severe weather outlook is issued by the National Weather Service's Storm Prediction Center. |
 |
One Month Temperature OutlookThe One Month Temperature Outlook is produced by the National Weather Service's Climate Prediction Center. |
 |
One Month Precipitation OutlookThe One Month Precipitation Outlook is produced by the National Weather Service's Climate Prediction Center. |
 |
Three Month Temperature OutlookThe Three Month Temperature Outlook is produced by the National Weather Service's Climate Prediction Center. |
 |
Three Month Precipitation OutlookThe Three Month Precipitation Outlook is produced by the National Weather Service's Climate Prediction Center. |
Cattle Comfort Advisor |
|
Farm Monitor |
|
Irrigation Planner |
|
 |
Drift Risk Advisor |
Degree Day Heat Units |
|
Drought |
|
Evapotranspiration |
|
Dispersion |
|
Dispersion Forecast Table |
|
 |
Past Dispersion Table |
 |
Dispersion Forecast Map |
U.S. Drought Monitor Map |
|
Oklahoma Drought Monitor Map |
|
Precip Needed - Palmer Drought Index |
|
Palmer Drought Index |
|
Short Crop (Etos) ET Map |
|
Tall Crop (Etrs) ET Map |
|
Seasonal Single Site ET Table |
|
Statewide Single Day ET Table |
|
Degree-day Heat Unit Calculator |
|
Leaf Spot Advisor |
|
Season Long Hours Table |
|
Forecast Leaf Spot Hours Table |
|
Last 14 Days and Forecast Hours Graph |
|
Three-year Comparison Table |
|
Past Years Comparison Graph |
|
Daily Comparison Graph |
|
Hours Map |
|
Wheat Growth Day Counter (GreenSeeker) |
|
Black Rot Advisor |
|
Season-Long Table |
|
Forecast Grape Black Rot Days Table |
|
Historical Comparison Table |
|
Comparison Graph |
|
Risk Days Map |
|
Pecan Scab Advisor |
|
Last 14-day and Forecast Pecan Scab Hours Graph |
|
Forecast Hours Table |
|
Three-year Comparison Graph |
|
Season Long Hours Map |
|
Spinach White Rust Advisor |
|
Last 7 Days and Forecast White Rust Hours Graph |
|
Season-Long Hours Table |
|
Forecast Spinach White Rust Hours Table |
|
White Rust Hours Map |
|
Degree-day Heat Units Calculator |
|
Graph |
|
Table |
|
Comparison Table |
|
Maximum |
|
Minimum |
|
Average |
|
Two Days Ahead Forecast Minimum Cattle Comfort Map |
|
Today's Forecast Minimum Cattle Comfort Map |
|
Today's Forecast Maximum Cattle Comfort Map |
|
Tomorrow's Forecast Minimum Cattle Comfort Map |
|
Two Days Ahead Forecast Maximum Cattle Comfort Map |
|
Tomorrow's Forecast Maximum Cattle Comfort Map |
|
Poultry Dispersion Forecast Map |
|
Poultry Dispersion Forecast Table |
|
Swine Dispersion Forecast Table |
|
 |
1000-hr Dead Fuel Moisture |
 |
1-hr Dead Fuel Moisture |
 |
Energy Release Component |
 |
Spread Component |
 |
10-hr Dead Fuel Moisture |
 |
Ignition Component |
 |
Live Woody Moisture |
 |
Live Herbaceous Moisture |
 |
100-hr Dead Fuel Moisture |
Mesonet Monthly Rainfall Table |
|
 |
Daily Top 15 ListsThe Daily Top 15 Lists displays the Warmest Maximum Temperatures, Coolest Maximum Temperatures, Warmest Minimum Temperatures Coolest Minimum Temperatures, Greatest Rainfall Totals, Sunniest Stations, and Windiest Stations across the Oklahoma… |
 |
6-hr Fire Weather Conditions ArchiveThis product shows a 6-hour archive of inversion and fire weather conditions maps at 15-minute intervals. The Fire Weather Conditions map displays:
|
 |
Soil Temperature Graph |
 |
Soil Moisture GraphThe Soil Moisture Graph plots the Fractional Water Index for a station through time. The user can pick either a 7, 15, 30, 60, or 90 day period. Fractional Water… |
 |
NWS Day 1 Precipitation ForecastThe Day 1 Precipitation Forecast is produced by the National Weather Service's Weather Prediction Center. |
 |
NWS Day 2 Precipitation ForecastThe Day 2 Precipitation Forecast is produced by the National Weather Service's Weather Prediction Center. |
 |
NWS Day 3 Precipitation ForecastThe Day 3 Precipitation Forecast is produced by the National Weather Service's Weather Prediction Center. |
 |
NWS Days 1-2 Precipitation ForecastThe Days 1-2 Precipitation Forecast is produced by the National Weather Service's Weather Prediction Center. |
 |
NWS Days 1-3 Precipitation ForecastThe Days 1-3 Precipitation Forecast is produced by the National Weather Service's Weather Prediction Center. |
 |
NWS Days 1-5 Precipitation ForecastThe Days 1-5 Precipitation Forecast is produced by the National Weather Service's Weather Prediction Center. |
 |
Day 1 Fire OutlookThe day 1 fire weather outlook is issued by the National Weather Service's Storm Prediction Center. |
 |
Day 2 Fire OutlookThe day 2 fire weather outlook is issued by the National Weather Service's Storm Prediction Center. |
Alfalfa Weevil Heat Units |
|
Heat Units Since January 1st |
|
Season-long Heat Units |
|
Current Daily Advisor |
|
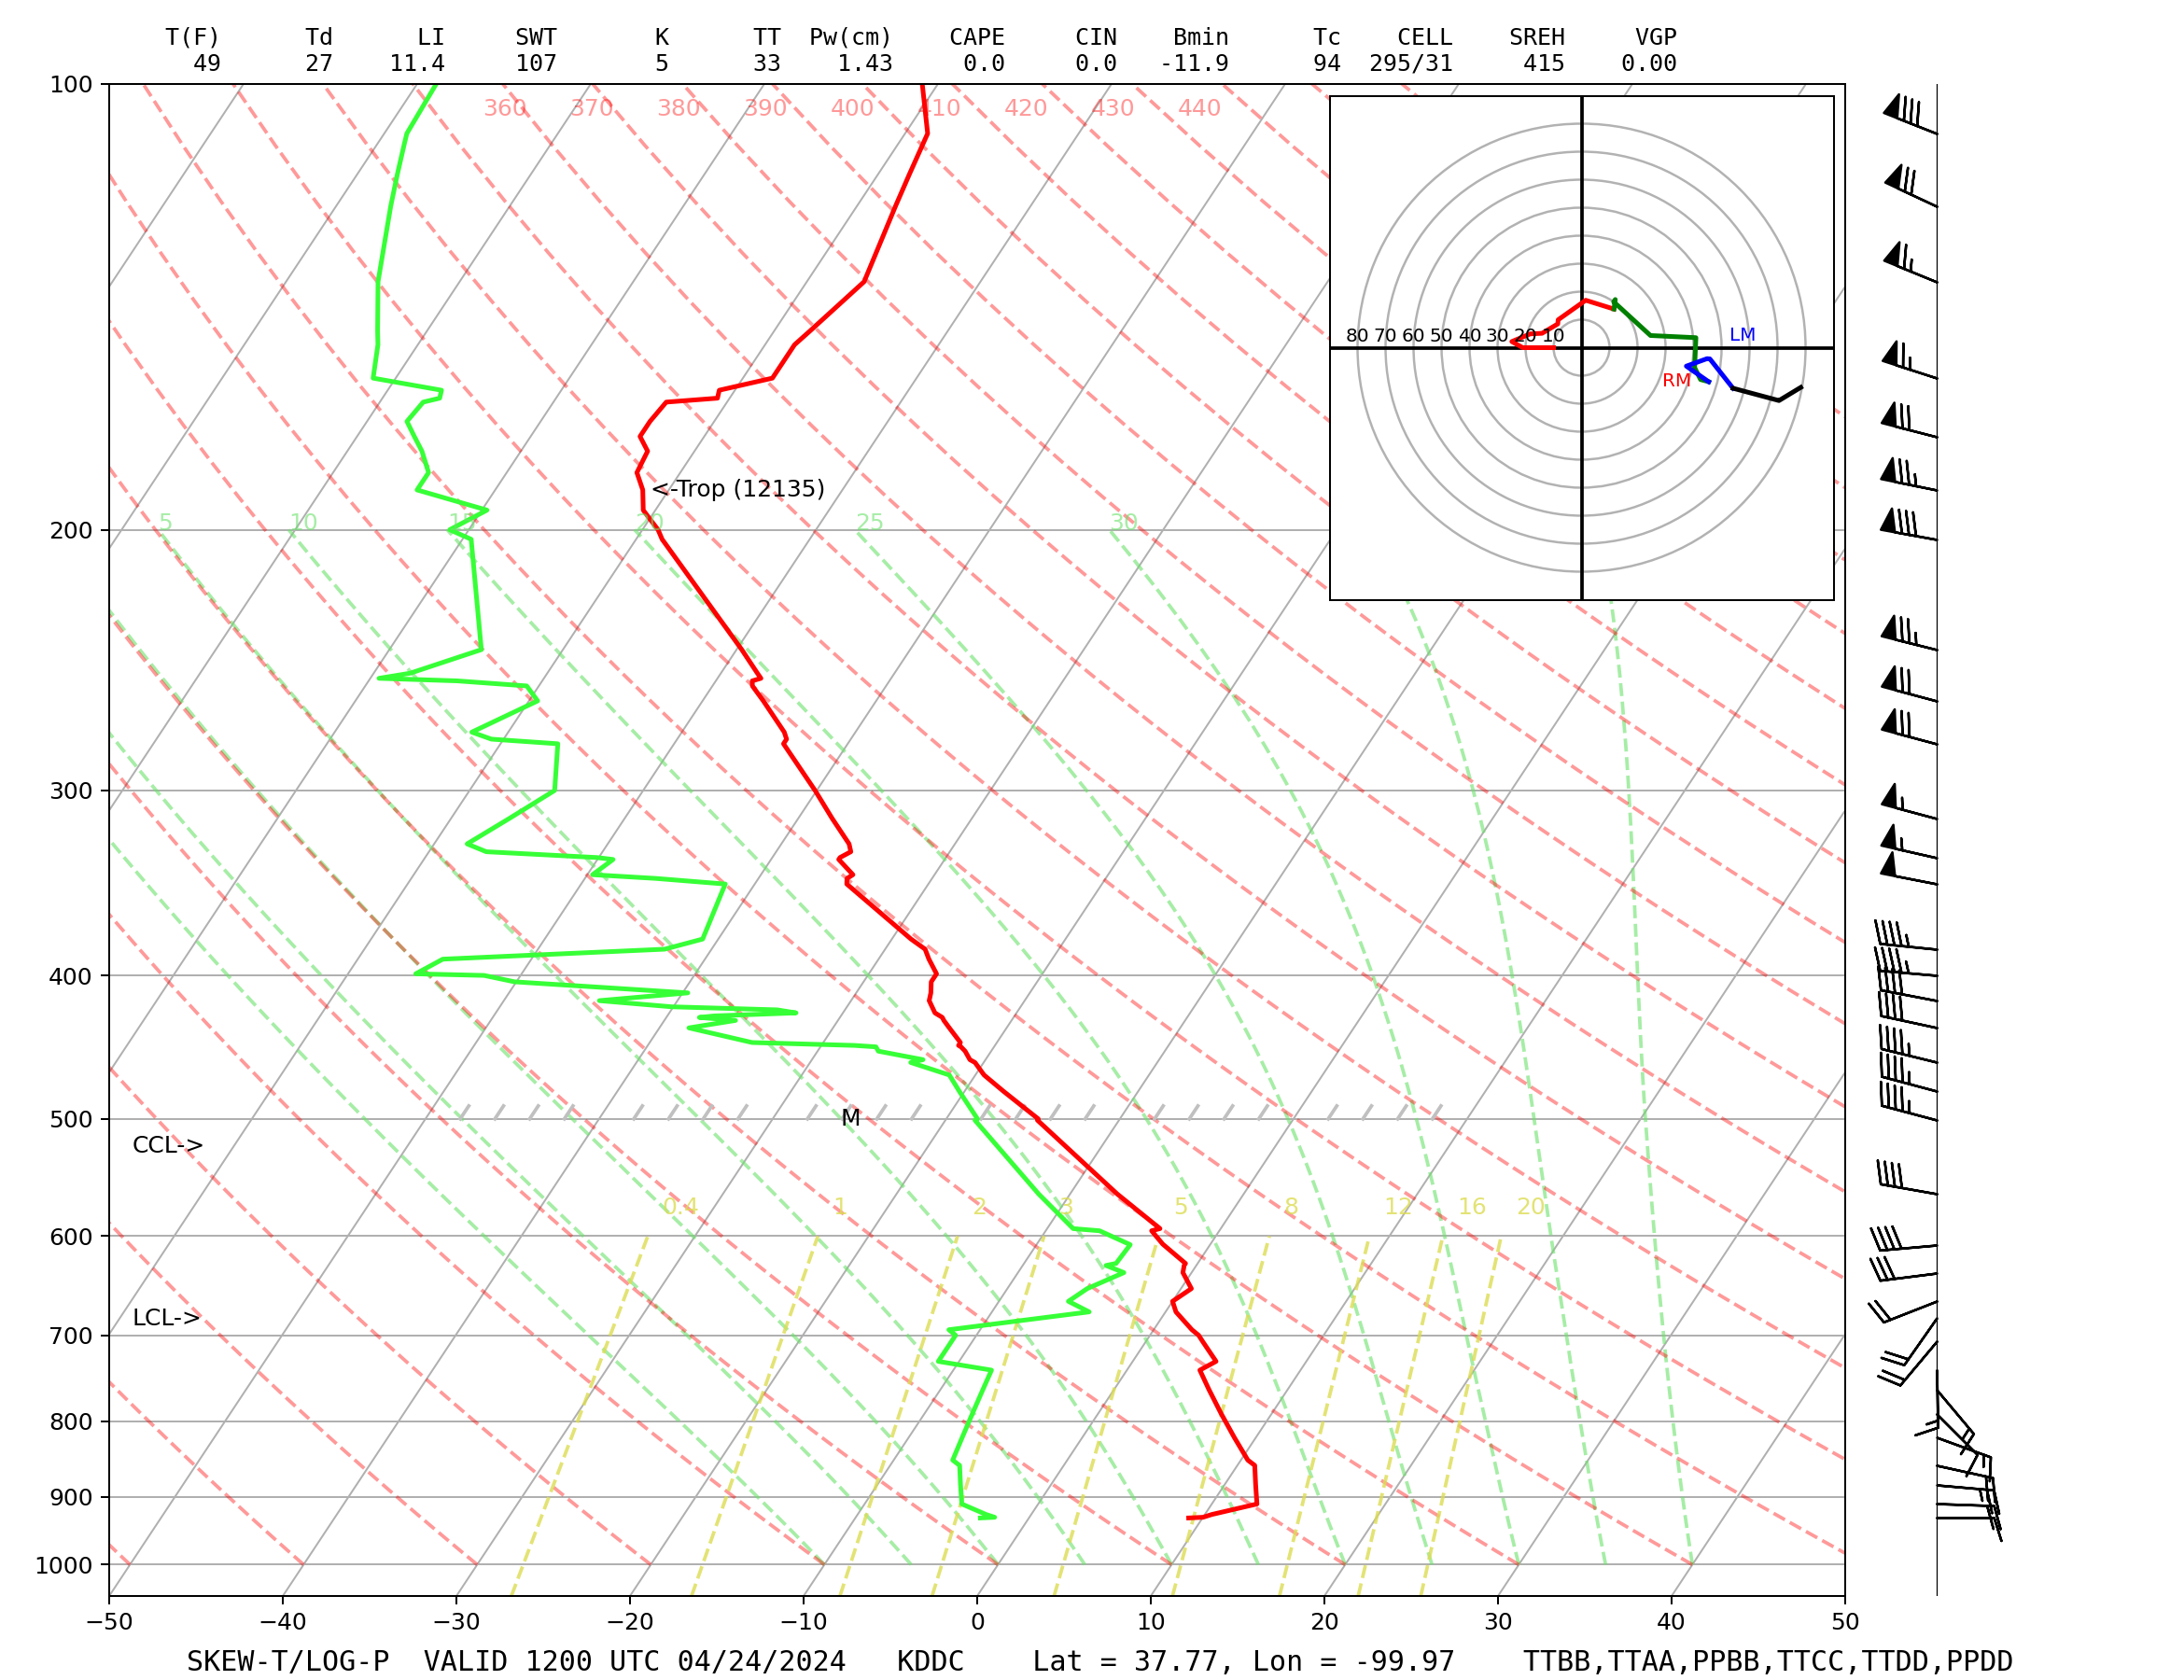 |
Dodge City KS Sounding |
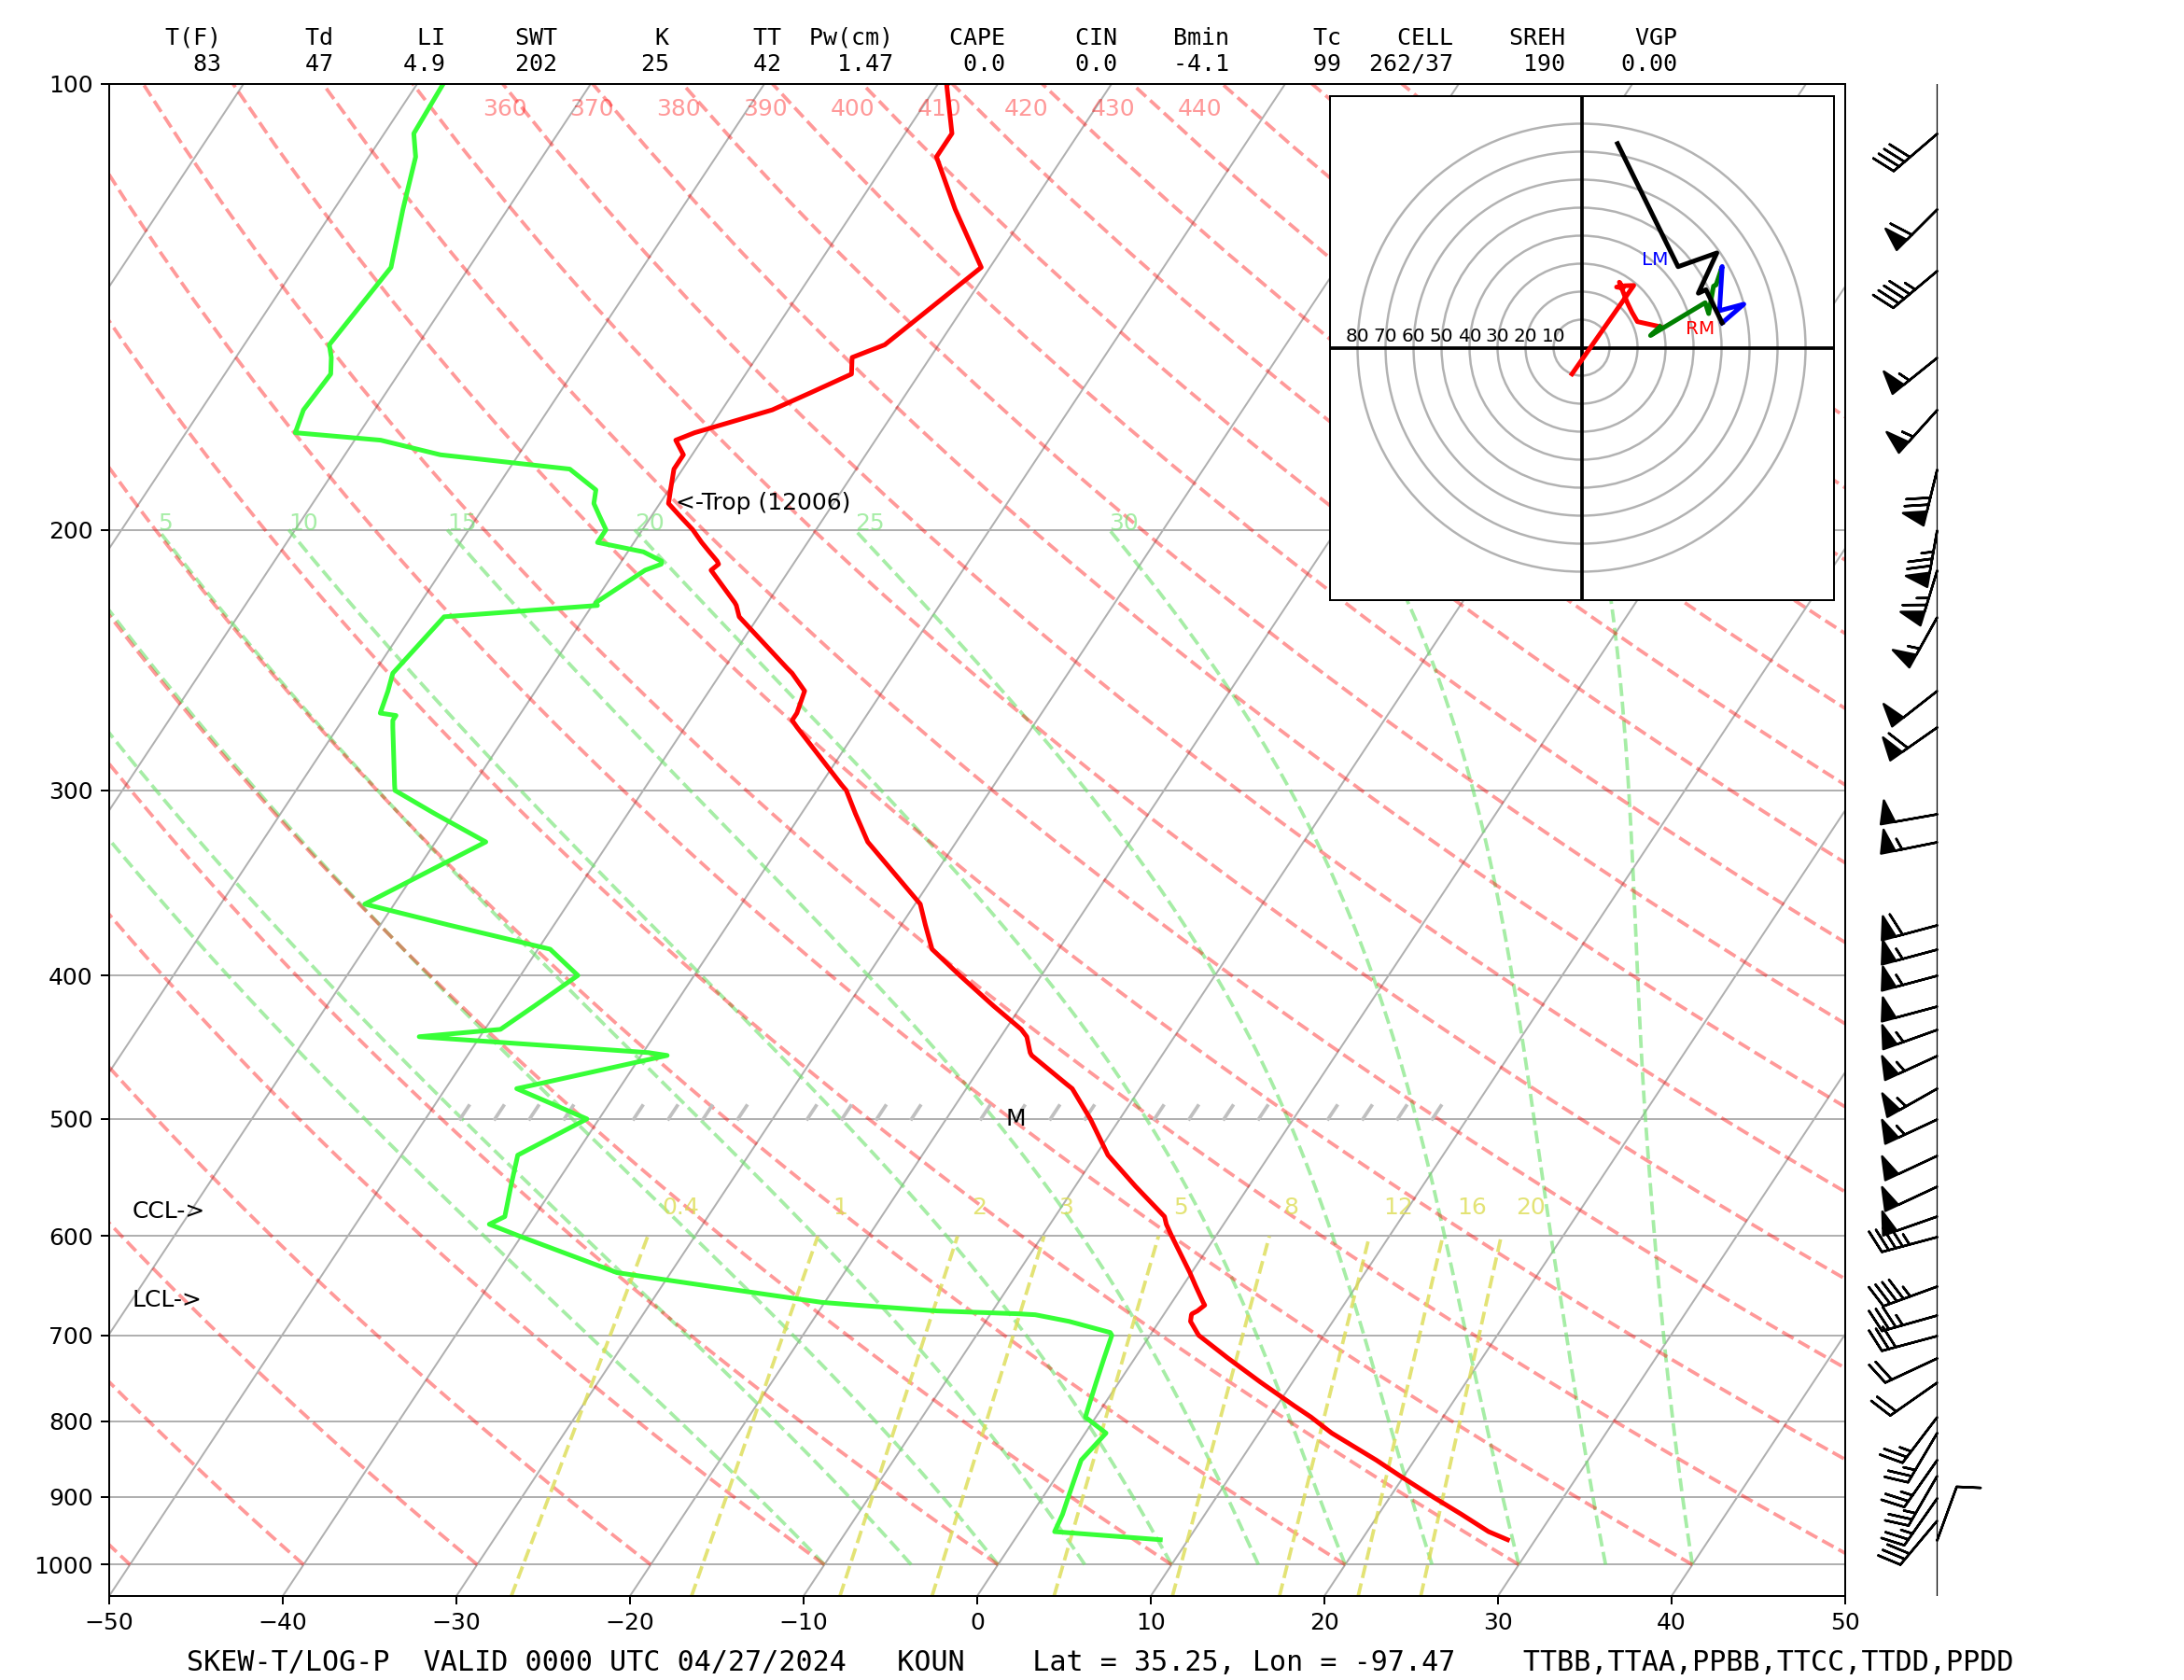 |
Norman OK Sounding |
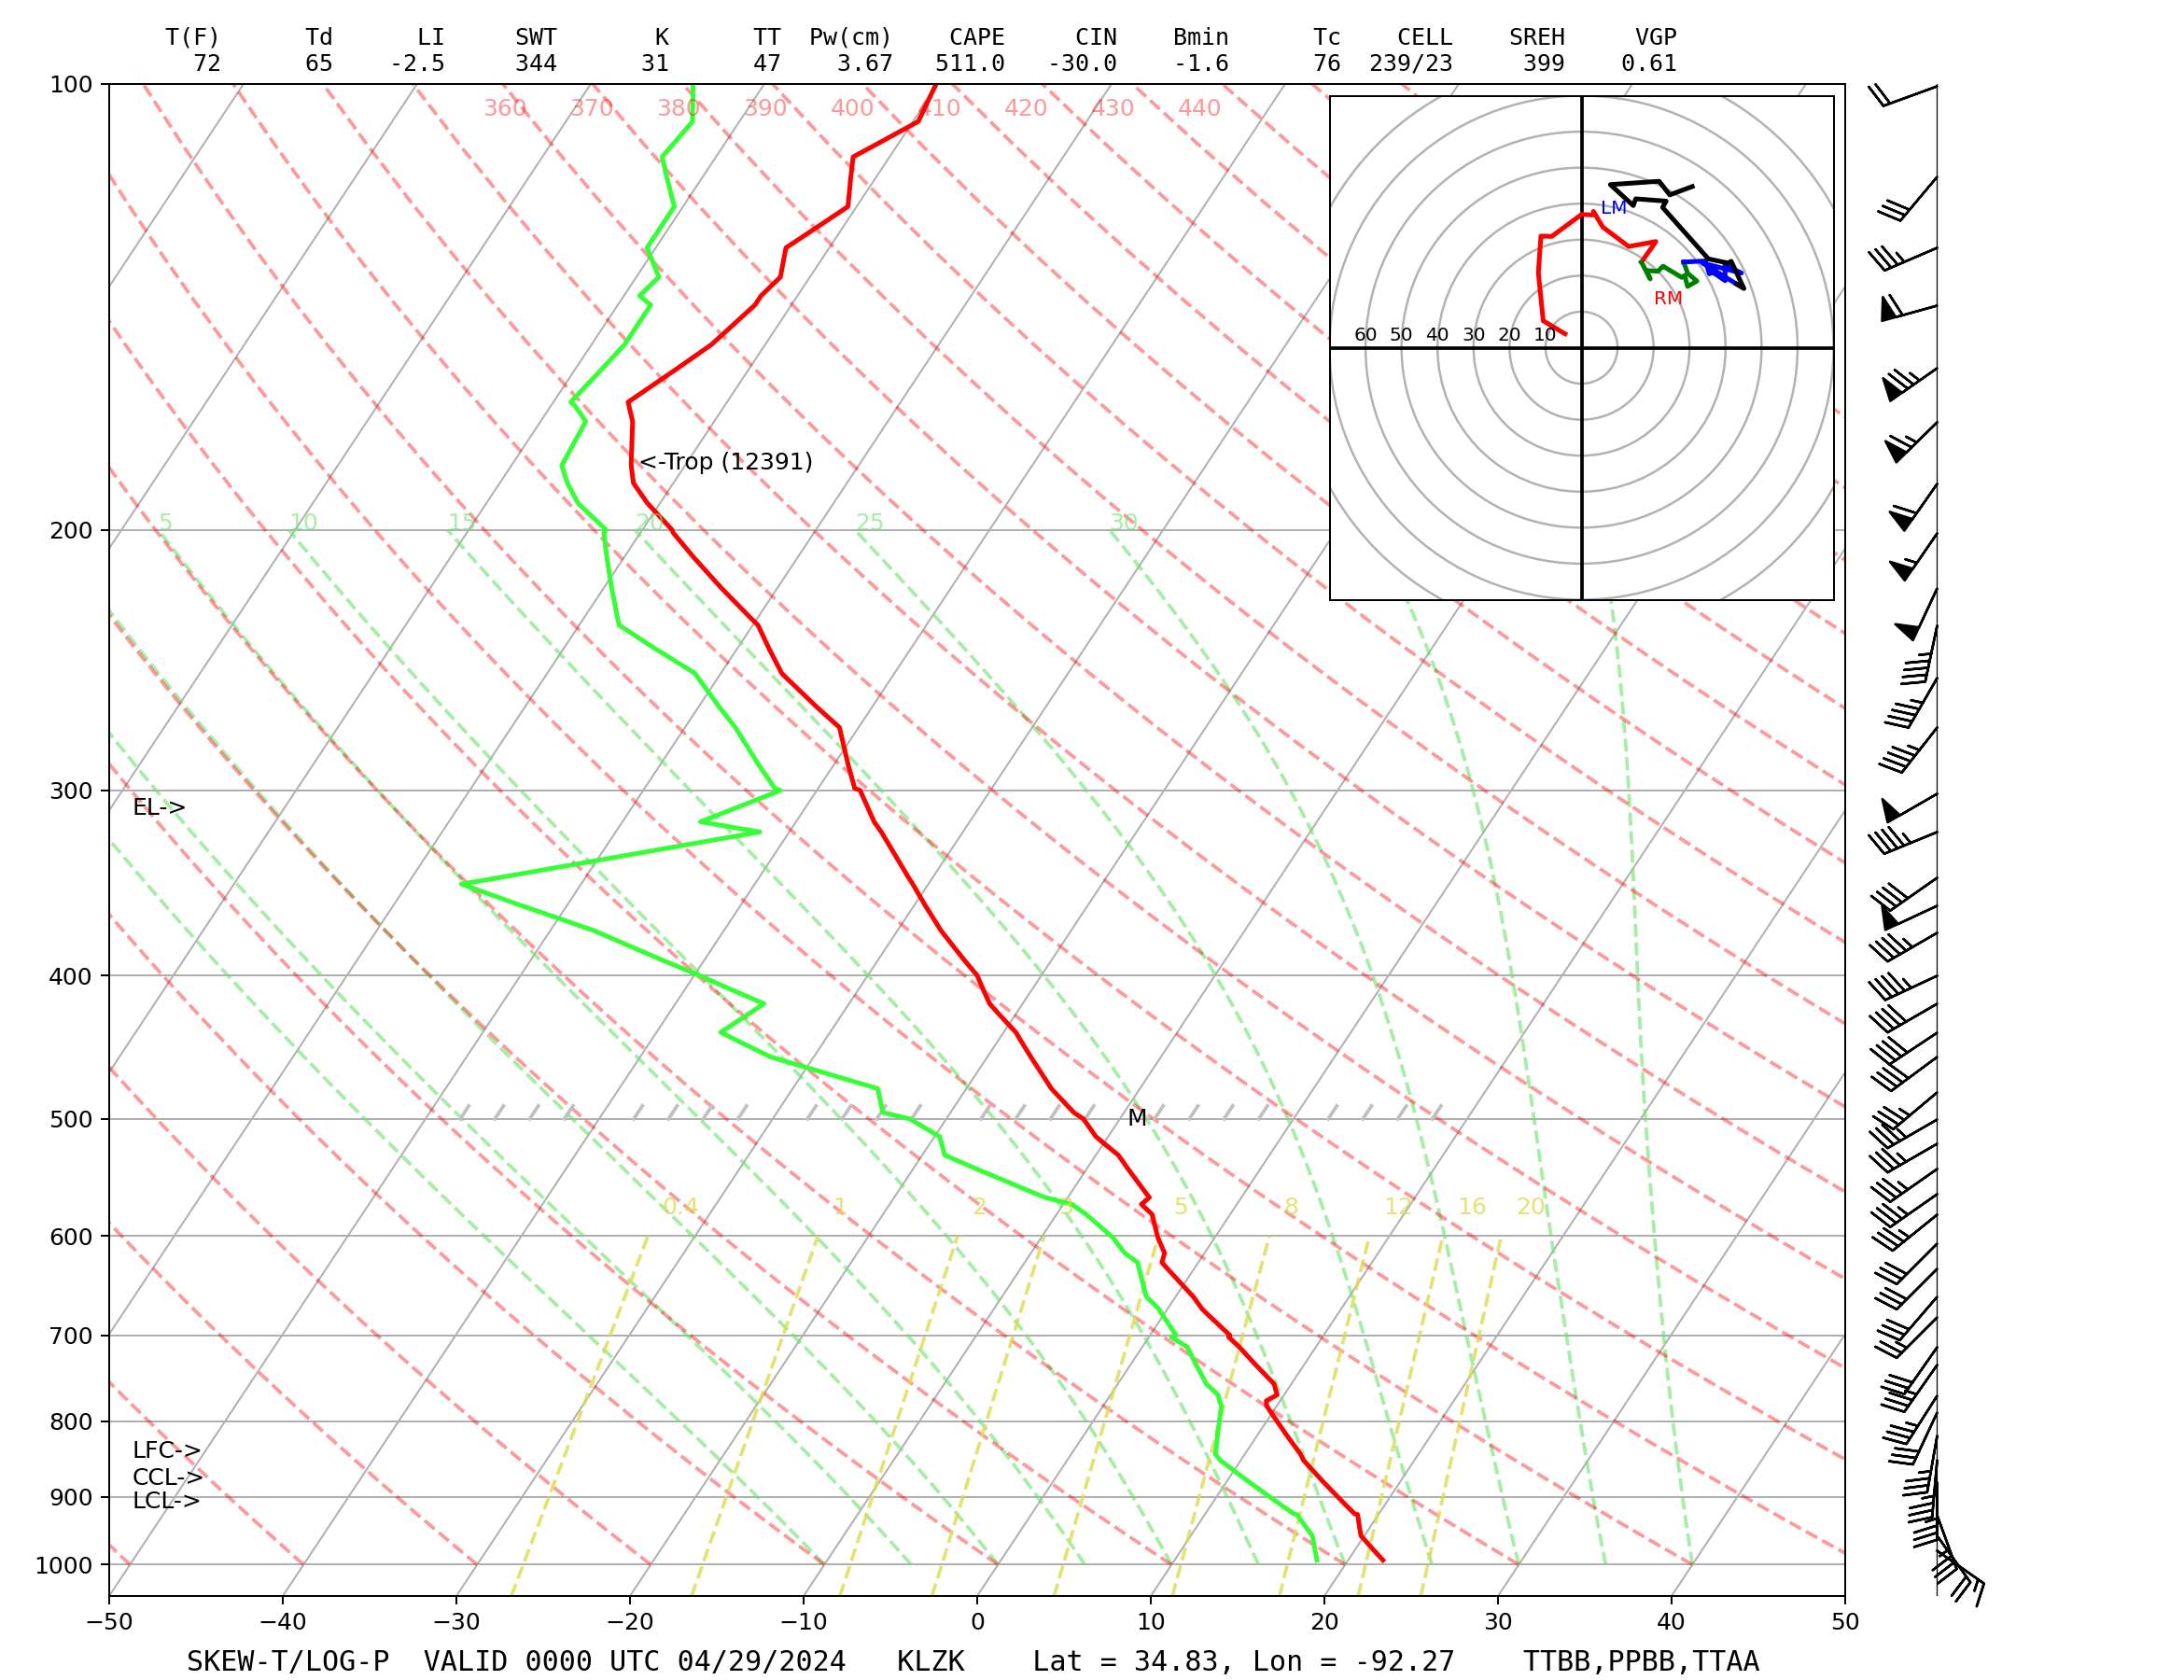 |
Little Rock AR Sounding |
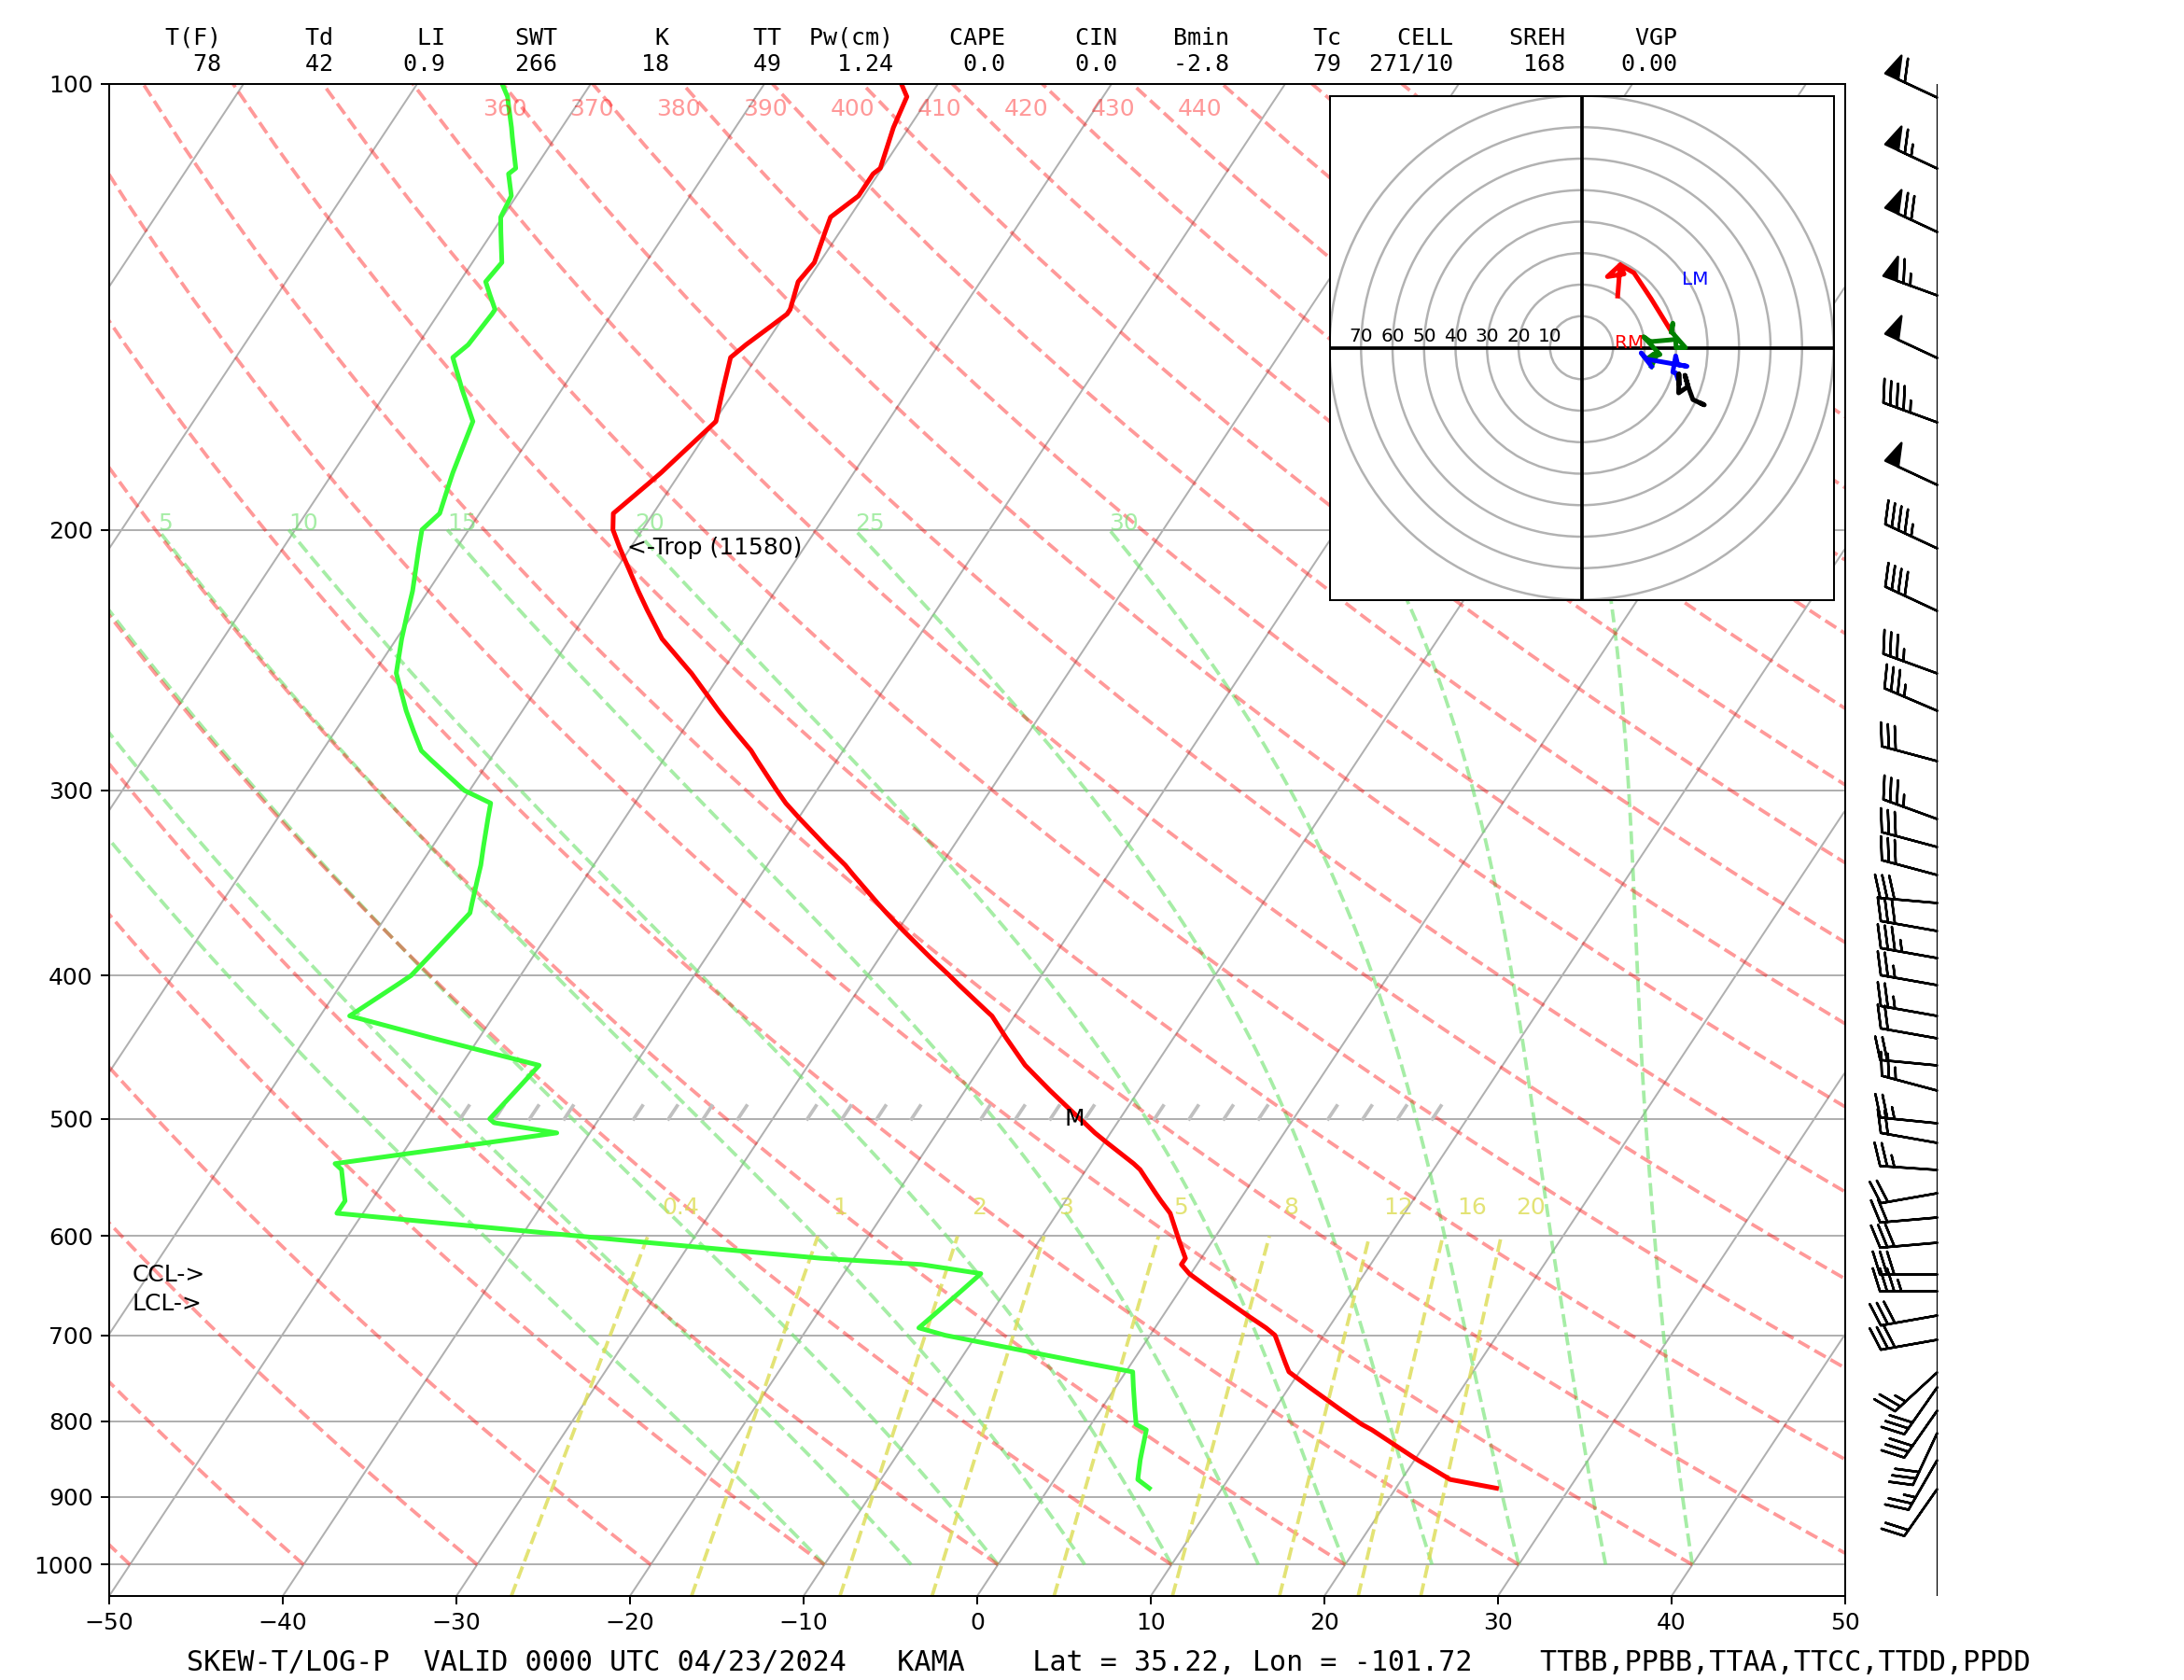 |
Amarillo TX Sounding |
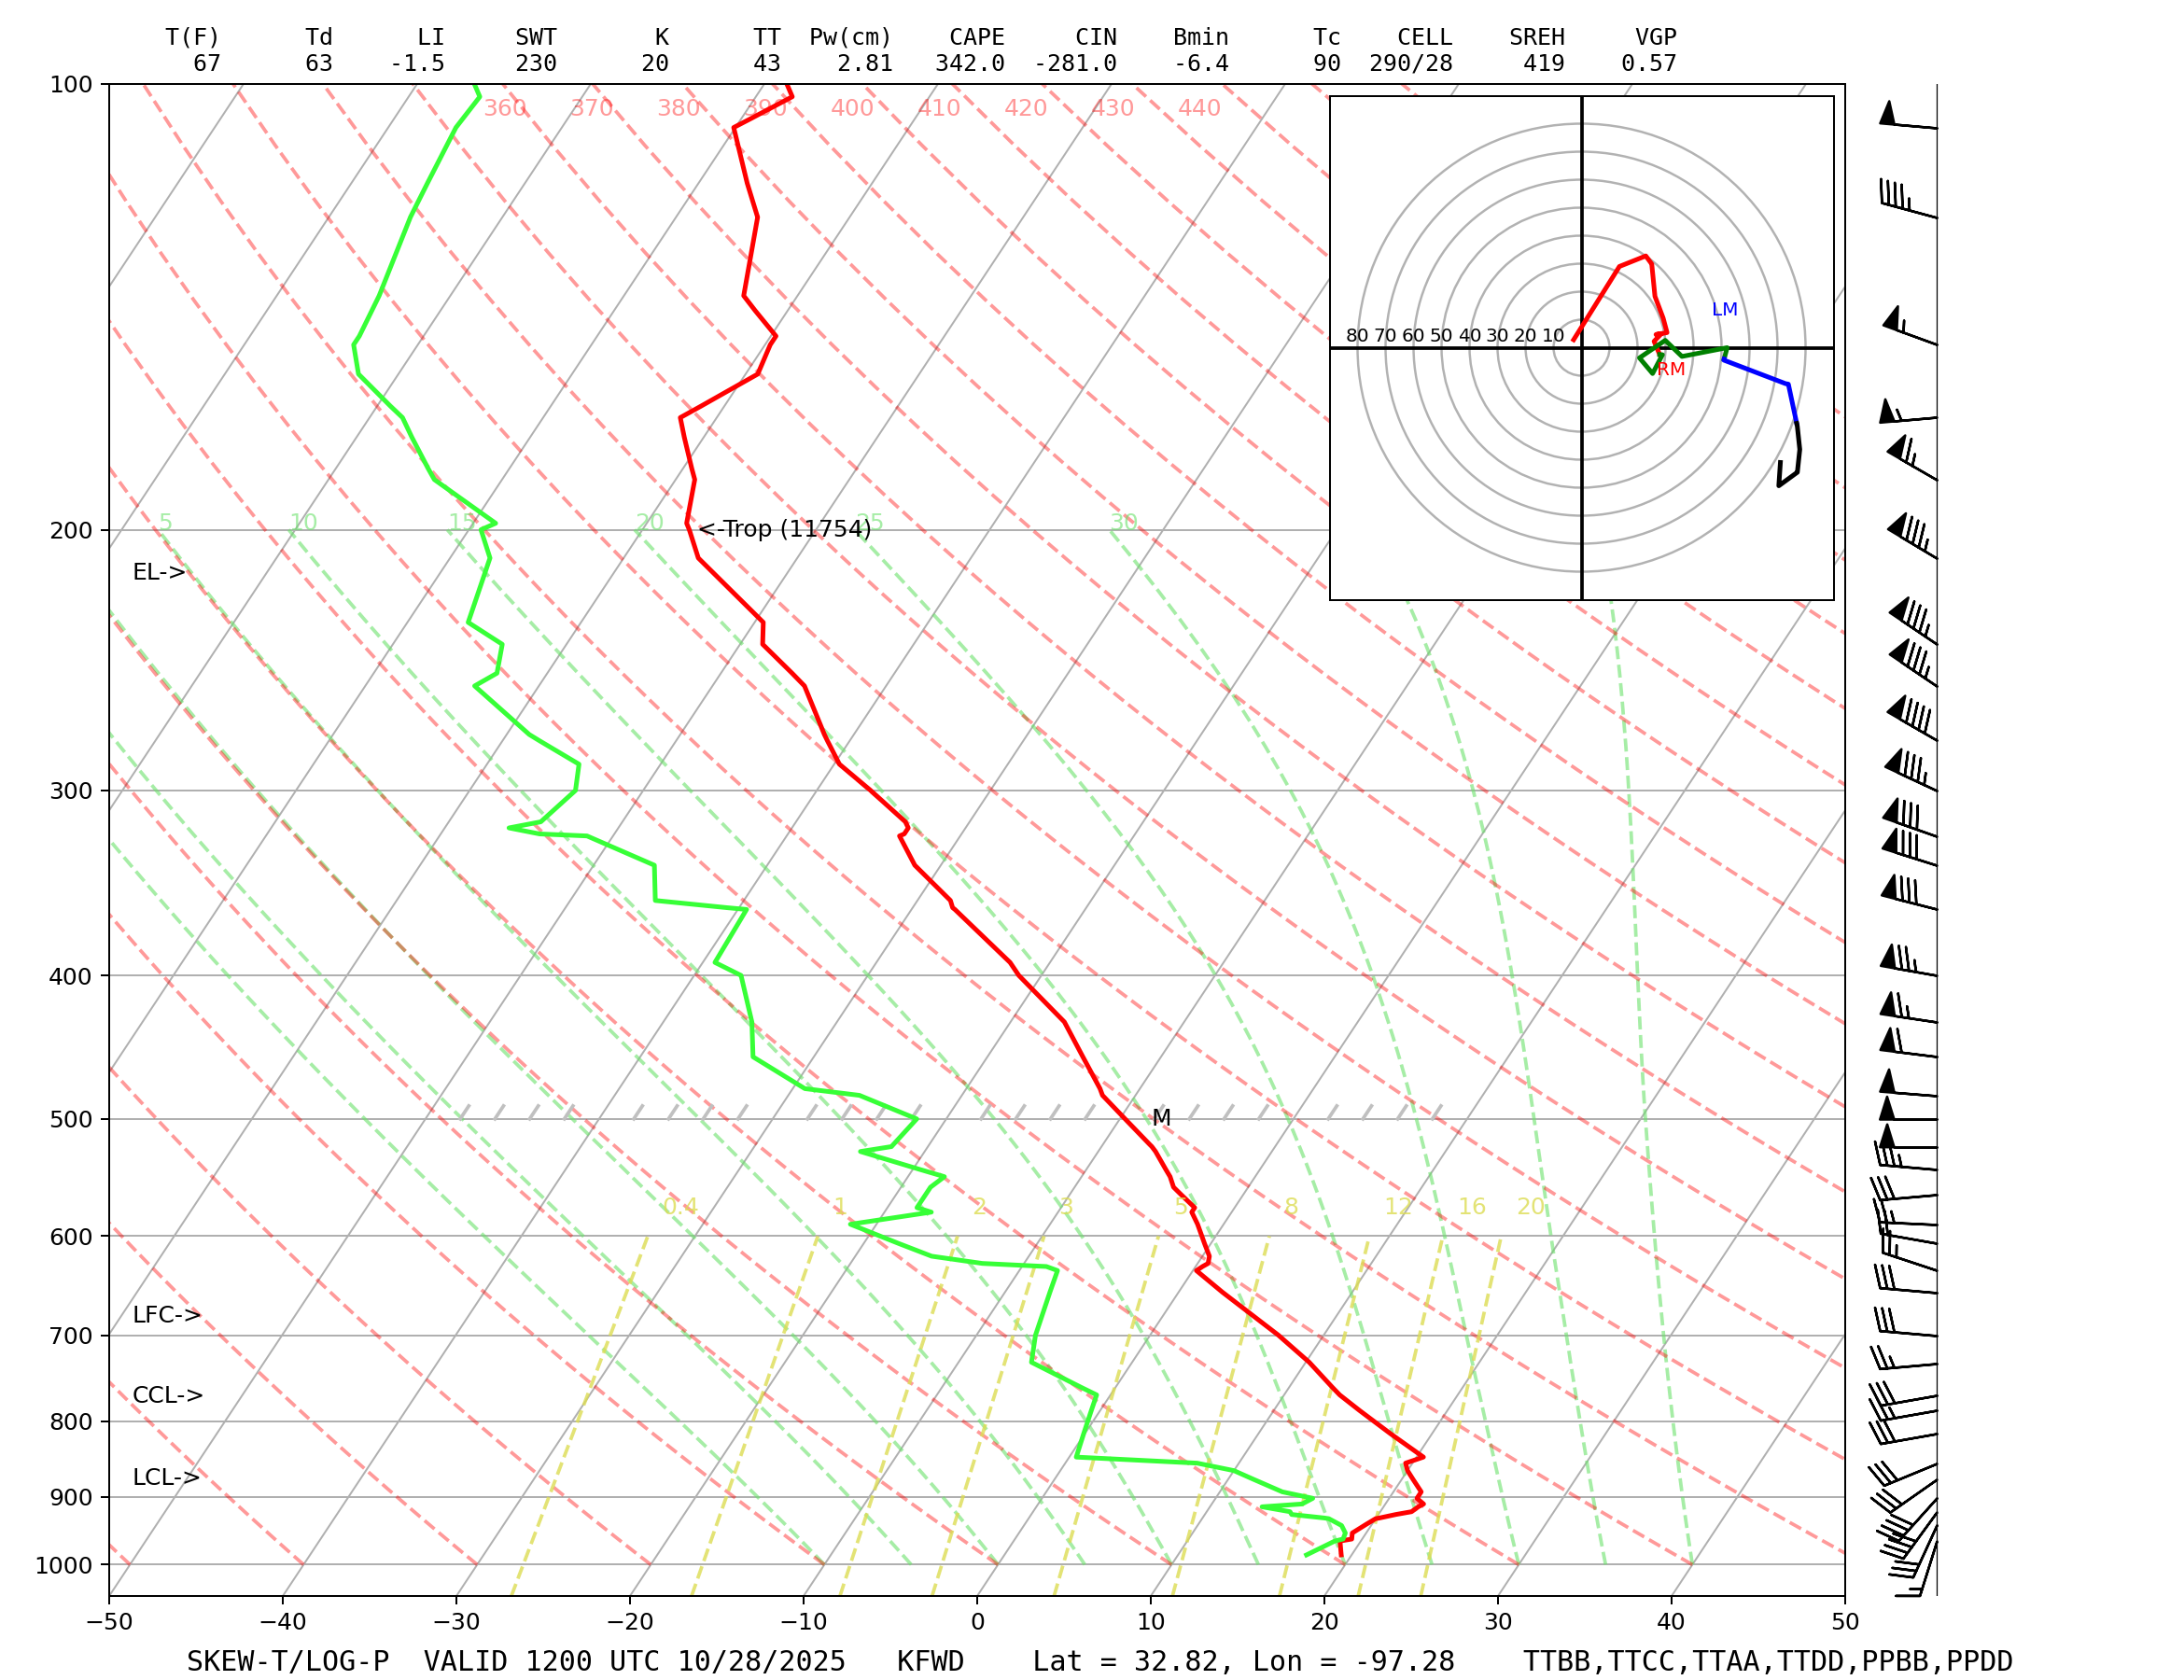 |
Fort Worth TX Sounding |
 |
WPC Snow/Ice Forecast, Day 1The WPC Snow/Ice Forecast is produced by the NWS Weather Prediction Center. |
 |
WPC Snow/Ice Forecast, Day 2The WPC Snow/Ice Forecast is produced by the NWS Weather Prediction Center. |
 |
WPC Snow/Ice Forecast, Day 3The WPC Snow/Ice Forecast is produced by the NWS Weather Prediction Center. |
 |
Day 1 Tornado OutlookThe Day 1 Tornado Outlook is issued by the National Weather Service's Storm Prediction Center. |
 |
Day 1 Hail OutlookThe Day 1 Hail Outlook is issued by the National Weather Service's Storm Prediction Center. |
 |
Day 1 Wind OutlookThe Day 1 Wind Outlook is issued by the National Weather Service's Storm Prediction Center. |
Local Fire Conditions |
|
 |
Mesonet Long-Term Averages - GraphsThe Mesonet long-term averages utilize 15 years of daily data (e.g. daily average, daily maximum/minimum, or daily total) for every current and past Oklahoma Mesonet station. For a station's data… |
|
Temp/RH/Dew Graph |
 |
U.S. Monthly Drought OutlookThe U.S. Monthly Drought Outlook is produced by the National Weather Service's Climate Prediction Center. The outlook is updated every 2 weeks. |
 |
60-day Rainfall AccumulationThe 60-day Rainfall Accumulation map displays accumulated rainfall observed at each Mesonet site in the last 60 days. This map also displays the NWS Arkansas-Red Basin River Forecast Center's… |
 |
90-day Rainfall AccumulationThe 90-day Rainfall Accumulation map displays accumulated rainfall observed at each Mesonet site in the last 90 days. This map also displays the NWS Arkansas-Red Basin River Forecast Center's… |
 |
120-day Rainfall AccumulationThe 120-day Rainfall Accumulation map displays accumulated rainfall observed at each Mesonet site in the last 120 days. This map also displays the NWS Arkansas-Red Basin River Forecast Center's… |
 |
180-day Rainfall AccumulationThe 180-day Rainfall Accumulation map displays accumulated rainfall observed at each Mesonet site in the last 180 days. This map also displays the NWS Arkansas-Red Basin River Forecast Center's… |
 |
365-day Rainfall AccumulationThe 365-day Rainfall Accumulation map displays accumulated rainfall observed at each Mesonet site in the last 365 days. This map also displays the NWS Arkansas-Red Basin River Forecast Center's… |
 |
14-day Rainfall AccumulationThe 14-day Rainfall Accumulation map displays accumulated rainfall observed at each Mesonet site in the last hour. This map also displays the NWS Arkansas-Red Basin River Forecast Center's rainfall… |
 |
10-inch Soil TemperatureThe 10-inch Soil Temperature map displays the current soil temperature (degrees F) at 10 inches (25 cm) under the existing vegetative cover at each Mesonet site. This map is updated… |
 |
24-inch Soil TemperatureThe 24-inch Soil Temperature map displays the current soil temperature (degrees F) at 24 inches (60 cm) under the existing vegetative cover at each Mesonet site. This map is updated… |
 |
1-day Average 10-inch Soil TemperatureThe 1-day Average 10-inch Soil Temperature map displays the 24-hour-averaged soil temperature (degrees F) at 10 inches (25 cm) under the existing vegetative cover at each Mesonet site for the… |
 |
1-day Average 24-inch Soil TemperatureThe 1-day Average 24-inch Soil Temperature map displays the 24-hour-averaged soil temperature (degrees F) at 24 inches (60 cm) under the existing vegetative cover at each Mesonet site for the… |
 |
3-day Average 10-inch Soil TemperatureThe 3-day Average 10-inch Soil Temperature map displays the 72-hour-averaged soil temperature (degrees F) at 10 inches (25 cm) under the existing vegetative cover at each Mesonet site for the… |
 |
3-day Average 24-inch Soil TemperatureThe 3-day Average 24-inch Soil Temperature map displays the 72-hour-averaged soil temperature (degrees F) at 24 inches (60 cm) under the existing vegetative cover at each Mesonet site for the… |
First Hollow Stem Early Varieties Current Conditions Map |
|
First Hollow Stem Early Varieties 1 Week Projection Map |
|
First Hollow Stem Early Varieties 2 Week Projection Map |
|
First Hollow Stem Middle Varieties Current Conditions Map |
|
 |
First Hollow Stem Late Varieties Current Conditions Map |
First Hollow Stem Middle Varieties 1 Week Projection Map |
|
First Hollow Stem Late Varieties 1 Week Projection Map |
|
First Hollow Stem Middle Varieties 2 Week Projection Map |
|
First Hollow Stem Late Varieties 2 Week Projection Map |
|
Soil Heat Units (Early) |
|
Soil Heat Units (Late) |
|
Soil Heat Units (Middle) |
|
First Hollow Stem Advisor |
|
 |
1-day Average 4-inch Percent Plant Available WaterThe 1-day Average 4-inch Percent Plant Available Water map is derived by dividing the current daily 4-inch Plant Available Water value by the theoretical maximum 4-inch plant available water amount… |
 |
1-day Average 16-inch Percent Plant Available WaterThe 1-day Average 16-inch Percent Plant Available Water map is derived by dividing the current daily 16-inch Plant Available Water value by the theoretical maximum 16-inch plant available water amount… |
 |
1-day Average 32-inch Percent Plant Available WaterThe 1-day Average 32-inch Percent Plant Available Water map is derived by dividing the current daily 32-inch Plant Available Water value by the theoretical maximum 32-inch plant available water amount… |
 |
1-day Average 4-inch Fractional Water IndexThe 1-day Average 4-inch Fractional Water Index map displays the 24-hour-averaged soil moisture at 4 inches (10 cm) under native sod for the previous day. Fractional water index ranges from… |
 |
1-day Average 4-inch Bare Soil Fractional Water IndexThe 1-day Average 4-inch Bare Soil Fractional Water Index map displays the 24-hour-averaged soil moisture at 4 inches (10 cm) under bare soil for the previous day. Fractional water index… |
 |
Statistical Data |
 |
Sea-Level Pressure (millibars)The Sea Level Pressure map displays the current pressure, reduced to sea level, in millibars. The pressure data are reduced to sea level because surface pressure is directly proportional to… |
 |
3-hour Sea-Level Pressure Change (millibars)The 3-hour Sea-Level Pressure Change map displays the change in pressure at each Mesonet site (in millibars) over the past three hours. This map is updated every five minutes. |
 |
Natural Wet-Bulb TemperatureThe Natural Wet-bulb Temperature map plots the current natural wet-bulb temperature (degrees F) at the standard height of 1.5m (5 feet). The natural wet-bulb temperature is the lowest temperature that… |
 |
Relative Humidity and WindsThe Relative Humidity and Winds map displays the current relative humidity, displayed in percent (%), at each Mesonet site, as well as the average wind conditions across Oklahoma. Relative Humidity… |
 |
Dispersion Conditions and WindsThe dispersion conditions with 10-m wind vectors map displays the current dispersion conditions and 10-m wind vectors at each Mesonet site. Dispersion condition categories indicate the ability of the atmosphere… |
 |
Wind GustsThe current wind gusts map displays the highest wind gust (in mph) recorded at each Mesonet station in the past five minutes. This map is updated every 5 minutes. |
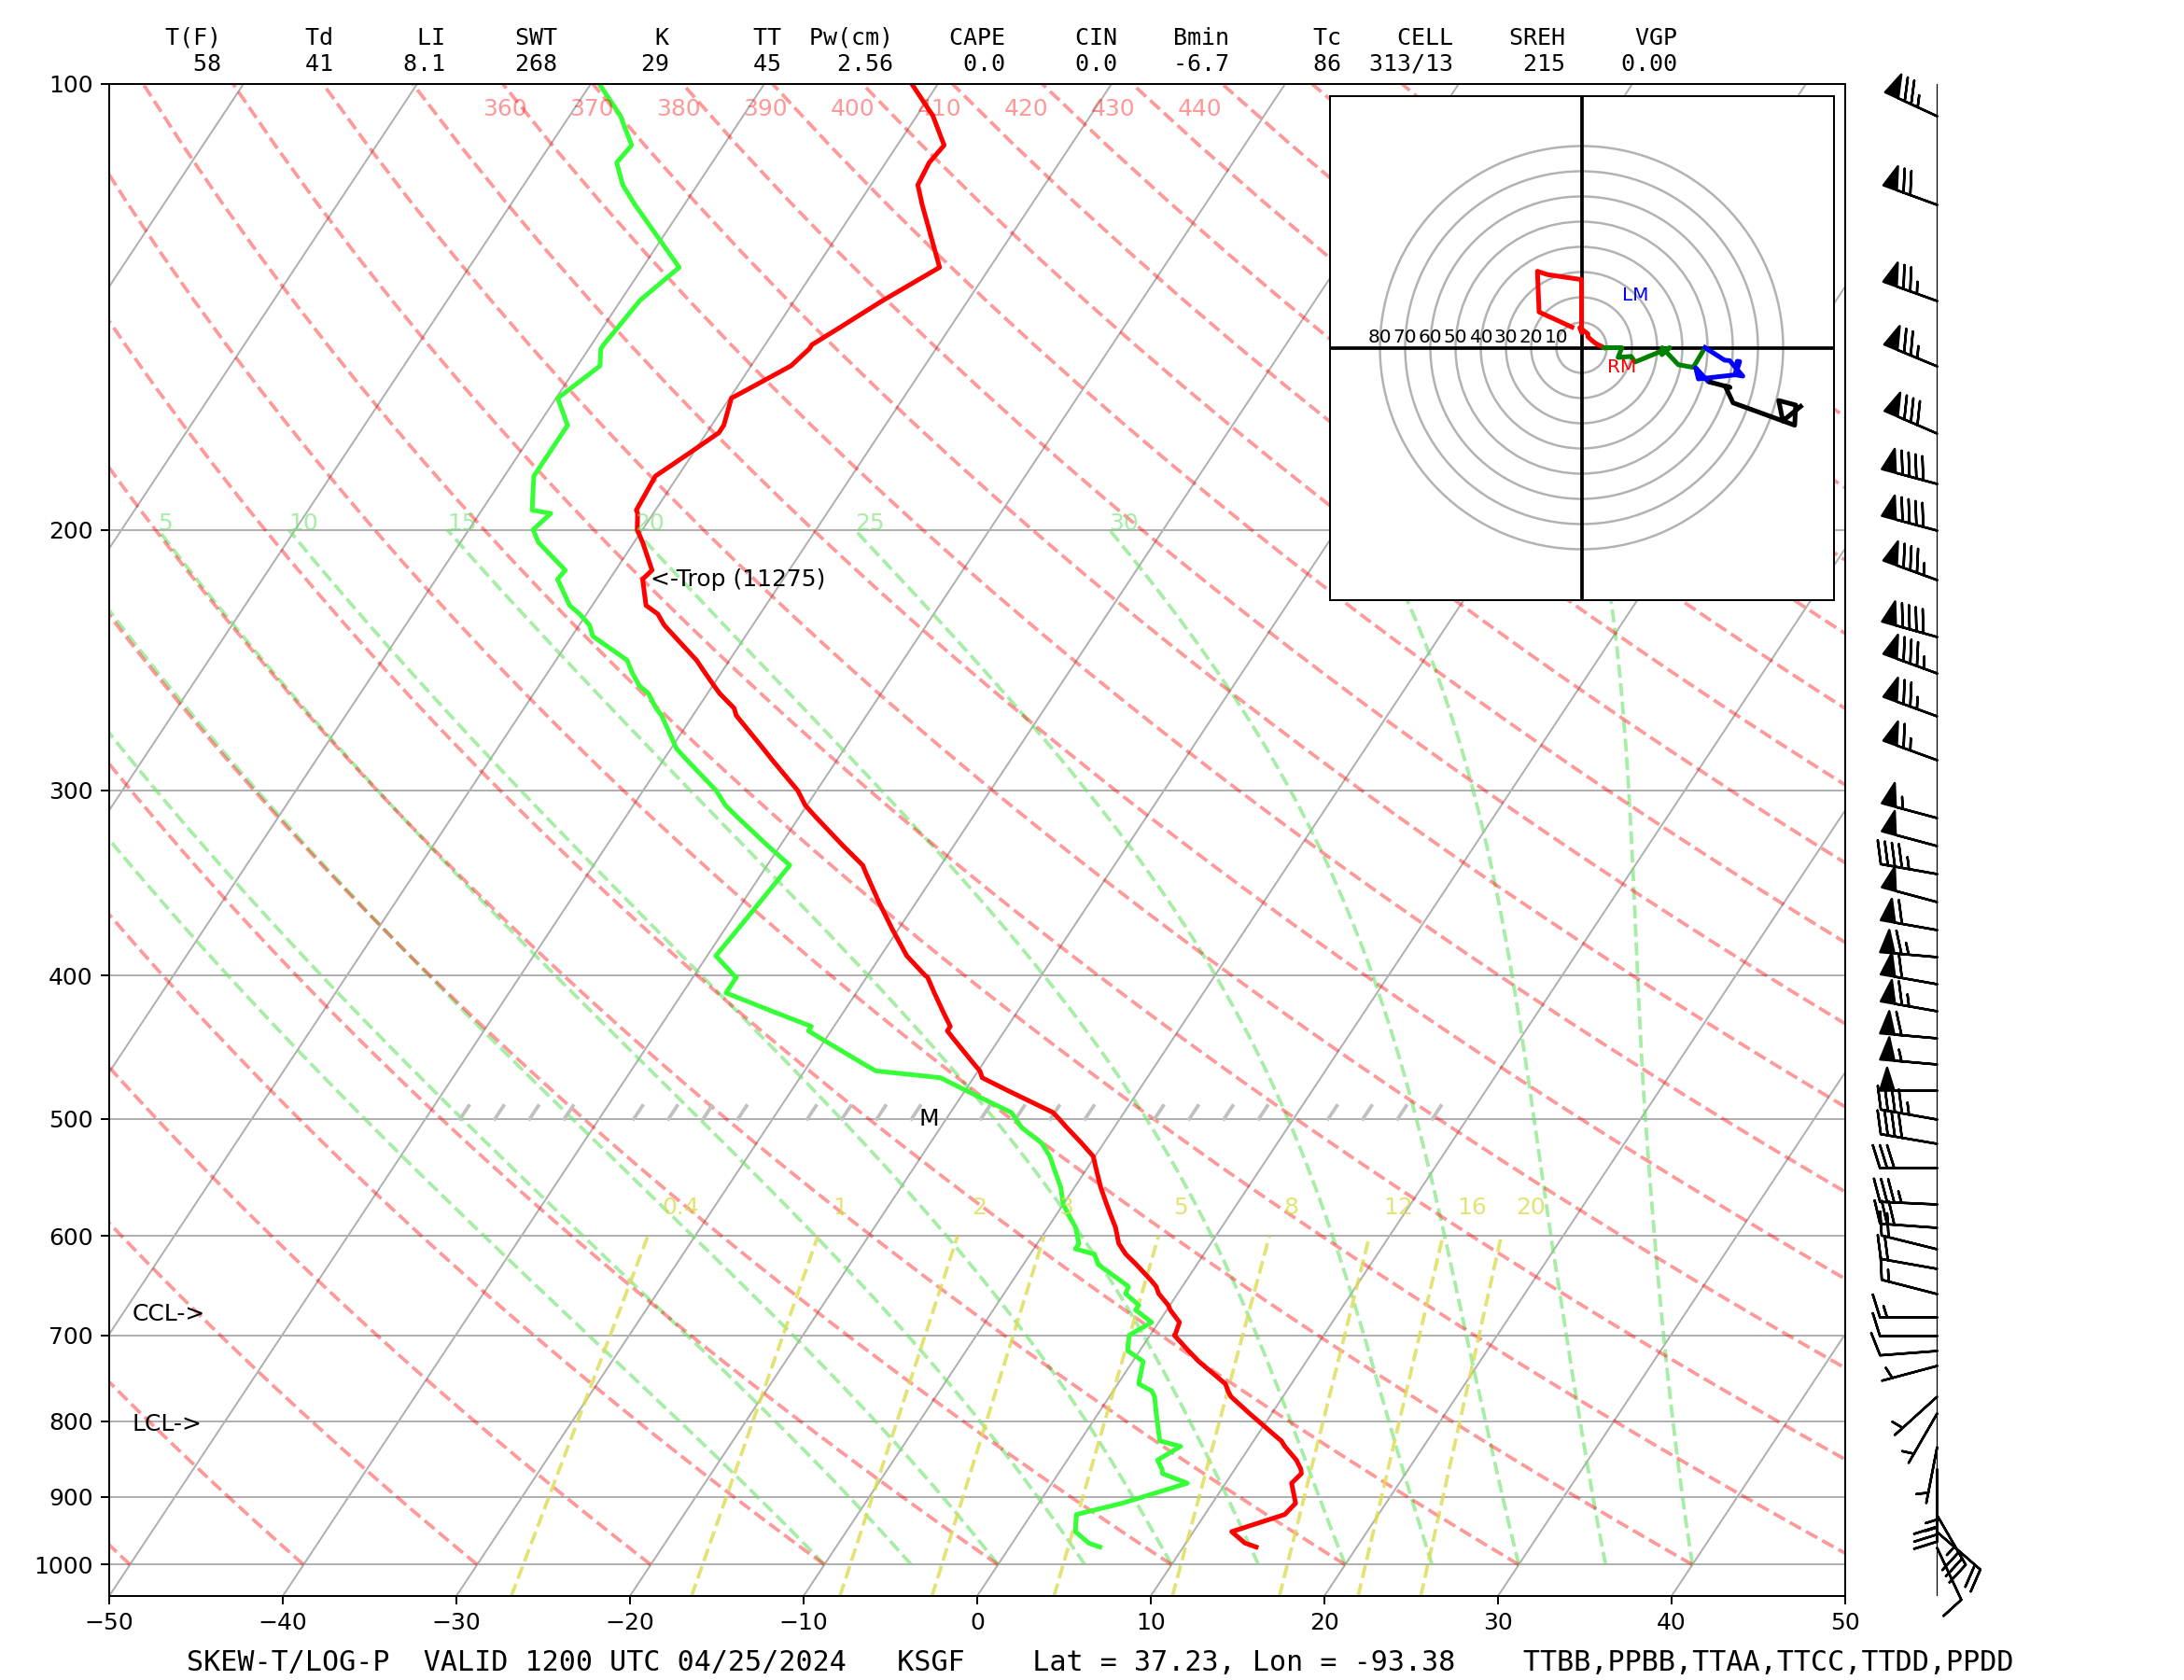 |
Springfield MO Sounding |
 |
Wet Bulb Globe Temperature RiskThe Wet Bulb Globe Temperature Risk map plots the current wet bulb globe temperature (degrees F) at the standard height of 1.5m (5 feet) along with its associated risk category.… |
Norman, OK Graphicasts |
|
Tulsa, OK Graphicasts |
|
Amarillo, TX Graphicasts |
|
Shreveport, LA Graphicasts |
|
 |
Today's Maximum Wet Bulb Globe Temperature RiskThe Today's Maximum Wet Bulb Globe Temperature Risk map plots the maximum wet bulb globe temperatures (degrees F) at the standard height of 1.5m (5 feet) along with its associated… |
 |
Yesterday's Maximum Wet Bulb Globe Temperature RiskThe Yesterday's Maximum Wet Bulb Globe Temperature Risk map plots the maximum wet bulb globe temperatures (degrees F) at the standard height of 1.5m (5 feet) along with its associated… |
 |
Total Daily Solar Radiation (kilowatt-hours per square meter)The Total Daily Solar Radiation map displays the integrated solar radiation (kWh/m^2) for each Mesonet station for the previous day. This map is updated each night. |
 |
Dewpoint Temperature and WindsThe Dewpoint Temperature and Winds map displays the current dewpoint temperature, displayed in Fahrenheit, at each Mesonet site, as well as the average wind conditions across Oklahoma. The arrows, known… |
 |
1-hr Relative Humidity ChangeThe 1-hour Relative Humidity Change map plots the change in relative humidity (%) at each Mesonet station over the past hour, information useful for showing recent RH trends so important… |
 |
3-hr Relative Humidity ChangeThe 3-hour Relative Humidity Change map plots the change in relative humidity (%) at each Mesonet station over the past 3 hours. This map is updated every 5 minutes. |
 |
Today's Maximum Relative HumidityThis map depicts the maximum relative humidity (%) occurring since midnight. This information is useful to see if fuel moisture recovery for 1- and 10-hour dead fuels has had a… |
 |
16-inch % Plant Available Soil MoisturePlotted values depict the percent of maximum plant available soil moisture currently in the top 16" of the soil profile. In the growing season (May through October), values <= 20%… |
 |
Keetch-Byram Drought Index (KBDI)The Keetch-Byram Drought Index (KBDI) is a drought index calculated by the Oklahoma Fire Danger Model. Ranging from 0 to 800, the index is used to increase the amount of… |
 |
Relative GreennessRelative Greenness (RG) ranges from 0-100% and indicates how green each 500-m square pixel of land is in relation to a 10+ year historical (2012-2022) database of greenness values for… |
 |
Visual GreennessVisual Greenness (VG) ranges from 0-100% and indicates how green each 500-m square pixel of land is in relation to a standard reference such as a highly green agricultural field.… |
 |
Oklahoma Water Vapor SatelliteThis Oklahoma satellite image displays the mid-level water vapor channel of the GOES-East satellite (Channel 9), which is typically at a pressure level around 500 millibars (approximately 18,000 feet). This… |
 |
Regional Water Vapor SatelliteThis regional satellite image displays the mid-level water vapor channel of the GOES-East satellite (Channel 9), which is typically at a pressure level around 500 millibars (approximately 18,000 feet). This… |
 |
Regional 3.9 micron InfraredThis satellite image displays the shortwave infrared wavelength band (band 7) from the GOES-16 satellite. This is a particular wavelength band (centered at 3.9 microns) that is very useful for… |
 |
Regional Infrared SatelliteThis regional satellite image displays one of the infrared (IR) channels of the GOES-East satellite (Channel 14). IR satellite images can show cloud coverage both during the daytime and nighttime.… |
 |
Oklahoma Water VaporThis satellite image displays the lower-level water vapor wavelength band (band 10) of the three water vapor bands from the GOES-16 satellite. The water vapor depicted by this particular band… |
 |
Regional Water VaporThis satellite image displays the lower-level water vapor wavelength band (band 10) of the three water vapor bands from the GOES-16 satellite. The water vapor depicted by this particular band… |
 |
Oklahoma 3.9 micron Infrared SatelliteThis satellite image displays the shortwave infrared wavelength band (band 7) from the GOES-16 satellite. This is a particular wavelength band (centered at 3.9 microns) that is very useful for… |
 |
Oklahoma Visible SatelliteThis Oklahoma satellite image displays the visible channel of the GOES-East satellite (Channel 2). During the daytime this map is useful for seeing clouds as well as features such as… |
 |
Regional Visible SatelliteThis regional satellite image displays the visible channel of the GOES-East satellite (Channel 2). During the daytime this map is useful for seeing clouds as well as features such as… |
 |
Oklahoma West 3.9 micron InfraredThis satellite image displays the shortwave infrared wavelength band (band 7) from the GOES-16 satellite. This is a particular wavelength band (centered at 3.9 microns) that is very useful for… |
 |
Oklahoma East 3.9 micron InfraredThis satellite image displays the shortwave infrared wavelength band (band 7) from the GOES-16 satellite. This is a particular wavelength band (centered at 3.9 microns) that is very useful for… |
 |
Oklahoma Visible (Blue)This satellite image displays the "blue" wavelength band (band 1), one of two visible bands from the GOES-16 satellite. During the daytime this map is particularly useful for seeing smoke… |
 |
Oklahoma West Visible (Blue)This satellite image displays the "blue" wavelength band (band 1), one of two visible bands from the GOES-16 satellite. During the daytime this map is particularly useful for seeing smoke… |
 |
Oklahoma East Visible (Blue)This satellite image displays the "blue" wavelength band (band 1), one of two visible bands from the GOES-16 satellite. During the daytime this map is particularly useful for seeing smoke… |
 |
Oklahoma West Visible (Red)This satellite image displays the "red" wavelength band (band 2), one of two visible bands from the GOES-16 satellite. During the daytime this map is particularly useful for seeing surface… |
 |
Oklahoma East Visible (Red)This satellite image displays the "red" wavelength band (band 2), one of two visible bands from the GOES-16 satellite. During the daytime this map is particularly useful for seeing surface… |
 |
Oklahoma West Water VaporThis satellite image displays the lower-level water vapor wavelength band (band 10) of the three water vapor bands from the GOES-16 satellite. The water vapor depicted by this particular band… |
 |
Oklahoma East Water VaporThis satellite image displays the lower-level water vapor wavelength band (band 10) of the three water vapor bands from the GOES-16 satellite. The water vapor depicted by this particular band… |
 |
Regional Visible (Blue)This satellite image displays the "blue" wavelength band (band 1), one of two visible bands from the GOES-16 satellite. During the daytime this map is particularly useful for seeing smoke… |
 |
AmarilloThis radar image from Amarillo shows the current base reflectivity at a 0.5 degree upward tilt of the radar beam. Local radar can be useful, as can satellite imagery in… |
 |
Oklahoma CityThis radar image from Oklahoma City shows the current base reflectivity at a 0.5 degree upward tilt of the radar beam. Local radar can be useful, as can satellite imagery… |
 |
TulsaThis radar image from Tulsa shows the current base reflectivity at a 0.5 degree upward tilt of the radar beam. Local radar can be useful, as can satellite imagery in… |
 |
Dodge CityThis radar image from Dodge City shows the current base reflectivity at a 0.5 degree upward tilt of the radar beam. Local radar can be useful, as can satellite imagery… |
 |
Vance AFBThis radar image from Vance Air Force Base shows the current base reflectivity at a 0.5 degree upward tilt of the radar beam. Local radar can be useful, as can… |
 |
WichitaThis radar image from Wichita shows the current base reflectivity at a 0.5 degree upward tilt of the radar beam. Local radar can be useful, as can satellite imagery in… |
 |
FrederickThis radar image from Frederick shows the current base reflectivity at a 0.5 degree upward tilt of the radar beam. Local radar can be useful, as can satellite imagery in… |
 |
Fort SmithThis radar image from Fort Smith shows the current base reflectivity at a 0.5 degree upward tilt of the radar beam. Local radar can be useful, as can satellite imagery… |
 |
Dallas - Fort WorthThis radar image from Dallas/Fort Worth shows the current base reflectivity at a 0.5 degree upward tilt of the radar beam. Local radar can be useful, as can satellite imagery… |
 |
Day 2 Tornado OutlookThe Day 2 Tornado Outlook is issued by the National Weather Service's Storm Prediction Center. |
 |
Day 2 Hail OutlookThe Day 2 Hail Outlook is issued by the National Weather Service's Storm Prediction Center. |
 |
Day 2 Wind OutlookThe Day 2 Wind Outlook is issued by the National Weather Service's Storm Prediction Center. |
Real-Time Lightning Detection (Source 3) |
|
 |
24-hour Maximum Dewpoint TemperatureThe 24-hour Maximum Dewpoint Temperature map displays the maximum dewpoint temperature (degrees F) at each Mesonet site over the past 24 hours. This map is updated every 5 minutes. |
 |
Today's Minimum Relative HumidityThis map depicts the minimum relative humidity (%) occurring since midnight. Relative humidity contributes to fuel moisture, which can inform fire danger potential. Daily minimum relative humidity can also be… |
Web Site
Welcome to the New Mesonet SiteWelcome to the new Mesonet site. We’ve worked to incorporate new features our users have requested. The new website includes:
|
|
Scorching August Closes Out Hot SummerScorching August Closes Out Hot Summer The end of August brings the climatological summer months (June-August) to a close… |
|
Another Warm Month Ends for OklahomaAnother Warm Month Ends For Oklahoma Oklahoma’s penchant for warmer-than-normal months continued during September and depending on where you… |
|
La Nina Could Bring Mild, Dry Winter to OklahomaLa Niña Could Bring Mild, Dry Winter to Oklahoma October has gotten off to a cool start in Oklahoma,… |
|
October’s Weather Warm and Dry, Could Continue Through Rest of 2010October’s Weather Warm and Dry, Could Continue Through Rest of 2010 Dry and warm conditions continued over much of… |
|
November 11, 1911: A Palindrome to RememberNovember 11, 1911: A Palindrome to Remember Oklahomans have grown accustomed to the fickle weather of the Great Plains, particularly… |
|
La Nina’s Influence Continues for OklahomaLa Nina’s Influence Continues for Oklahoma The mild and dry weather Oklahoma experienced through the first two months of… |
|
December, Year Warmer and Drier Than NormalDecember, Year Warmer and Drier Than Normal December tried to end 2010 in a tranquil manner after a year’s worth… |
|
Drought Continues to Persist, Worsen in OklahomaDrought Continues to Persist, Worsen in Oklahoma
|
|
Oklahoma Shatters All-Time Low Temperature RecordOklahoma Shatters All-Time Low Temperature Record The Oklahoma Mesonet station at Nowata reached a low… |
|
February Weather Full of Extremes, and RecordsFebruary Weather Full of Extremes, and Records In a state accustomed to extreme weather, February was a bit startling… |
|
Norman Chamber of Commerce's Job Shadow DayNews story here. |
|
EarthStorm-OK School of Science and Mathematics Summer InstituteThe Oklahoma School of Science and Mathematics is offering a week-long summer institute for middle school math teachers. Questions can be addressed to Tony Cornforth at (405)… |
|
EarthStorm-OK Algebra HighwayThe Oklahoma Algebra Highway: A Curricular Roadmap to Success
June 27-30, 2011 2 follow up days during the year - tentatively Oct 15th, 2011 and… |
|
Drought Takes Center Stage
Drought takes center stage in March Warm and dry weather grabbed the headlines as the record-setting extremes… |
|
EarthStorm-Air Quality Awareness 2011The U.S. Environmental Protection Agency (EPA) and the National Oceanic and Atmospheric Administration's (NOAA) National Weather Service urge Americans to "Be Air Aware" during Air Quality Awareness Week, May… |
|
“Exceptional” Drought Continues to Expand in Western Oklahoma“Exceptional” Drought Continues to Expand in Western Oklahoma May 5, 2011 Gary McManus Associate State Climatologist, Oklahoma Climatological Survey
Fresh off the heels… |
|
Oklahoma Mesonet Site Records Tornadic WindsOklahoma Mesonet Site Records Tornadic Winds Gary McManus Associate State Climatologist Oklahoma Climatological Survey
The Oklahoma Mesonet site located northwest of El Reno… |
|
Tornadoes Top Weather Story During MayTornadoes Top Weather Story During May Gary McManus Associate State Climatologist Oklahoma Climatological Survey
Even though severe weather only struck on a few… |
|
EarthStorm - OK SDE Math AcademyMath Academy slots still available This year's Math Academy will be held on June 28-30, 2011, at the National Center for Employee Development (NCED) Conference Center & Hotel, 2801 East… |
|
New OCS Web SiteThe new web site of the Oklahoma Climatological Survey provides direct access to the data, products, and services of OCS with a click of a button. The Climate, Weather,… |
|
Exceptional Drought Expands in Oklahoma
Exceptional Drought Expands in Oklahoma The extraordinary heat and wind during June has taken its… |
|
Black Sunday Remembered
That Sunday 75 years ago in the Oklahoma Panhandle began magnificently with bright sunshine, calm winds and plenty of spring… |
|
Drought flourishes during hot, dry June
Drought flourishes during hot, dry June The meager amount of rain that managed to fall on Oklahoma… |
|
Welcome USGS Leaders!On Monday, July 11, the University of Oklahoma (OU) will host a team of leaders from the U.S. Geological Survey (USGS) to determine the capabilities of a consortium of… |
|
Hot Enough for You?Oklahomans are used to 100-degree days, but typically not so many during June and certainly not for this long. In Altus, for example, the high temperature for June 2011… |
|
July Heat Becomes HistoricFueled by exceptional drought and a seemingly impenetrable heat-dome, July roared through Oklahoma’s legendary heat waves of the past to become the state’s hottest calendar month on record. According… |
|
Oklahoma July Warmest on Record for U.S.
Grover Cleveland was serving his second term as President in 1895. Victoria was the Queen of England and Will Rogers was still a teenager. It is also… |
|
Record August Puts Exclamation Point on Hottest Oklahoma SummerTo get a sense of the state’s legendary heat waves of its past, Oklahoma’s youngest generation would normally turn to the stories of parents, grandparents or great-grandparents. Tales of… |
|
EarthStorm - National Weather Festival 2011
EarthStormNews - Teacher VIP at Science Museum Oklahoma
Teachers! You are invited to join us for a special teacher VIP night at Science Museum Oklahoma! Reservations are required, so call 405-602-3760 to secure your spot… |
|
La Nina Returns, Continuation of Drought Likely for OklahomaLa Nina has officially returned to the equatorial pacific waters according to the National Weather Service’s Climate Prediction Center (CPC). The climate phenomenon, marked by cooler than normal waters… |
|
EarthStormNews - NSTA Webinar for CoCoRaHSTwo citizen science networks will be presented during this web seminar. Both involve networks that collect weather observations. One is the Cooperative Observer Program (COOP) which is a partnership… |
|
September Sees Relief on the Thermometer, Not the Rain GaugeWhile little relief from drought was found in September, the reprieve from the intense summer heat was nearly instantaneous. After three summer-like days to begin the month, fall weather… |
|
University of Oklahoma Selected to Host One of Eight Regional Climate Science Centers NationwideThe University of Oklahoma has been selected by the U.S. Department of the Interior as the site of one of only eight regional climate science centers nationwide, OU President… |
|
EarthStorm-ScienceFest 2012Register now for ScienceFest 2012ScienceFest will be held at the Oklahoma City Zoo on April 19, 2012. ScienceFest is a day of interactive science and environmental activities focusing on… |
|
Rains Ease Drought Woes During OctoberSeptember brought Oklahomans relief from the heat and October did its part with a bit of drought relief. The drought conditions remain quite severe across the state despite the… |
|
Walters Mesonet Station to MovePlanned construction near our Walters Mesonet station has prompted us to relocate the site. We have been working with the Cotton County Conservation folks to find a new location. … |
|
A Year of Extremes
Extreme weather grabbed headlines across the globe during 2011 and nowhere more so than right here in Oklahoma. The state experienced nearly every weather calamity possible, setting… |
|
EarthStorm-Job Shadow Program for Meteorology CareersApplications for the 2012 Job Shadow Day are available at:http://www.mesonet.org/index.php/earthstorm/page/job_shadow.
Deadline: February 3rd, 2012 Job Shadow Day:… |
|
Warm February Closes Out Eleventh Warmest Winter in OklahomaGolf clubs replaced parkas as the outdoor accessory of choice this winter, and Oklahoma’s kids can only dream of missed school days filled with sledding and snowball fights. The… |
|
Drought Ends for Much of Oklahoma
Drought Ends for Much of Oklahoma Thu, Mar 22, 2012
Heavy rain associated with this week’s slow-moving storm system brought one hazard back… |
|
OK Regents Summer Academies
This summer, invite your students to spend time at an Oklahoma college or university and discover the fascinating worlds of aeronautics, engineering, environmental conservation, forensic science and much more!… |
|
May Ends Warmest Spring in Oklahoma HistoryMay Ends Warmest Spring in Oklahoma History Fri. June 1, 2012
A pleasantly cool final day and scattered heavy rains during the month’s final week… |
|
June Ends On A Scorching Note
A blistering final week and a return to drought transformed June from a mildly hot month into a scorcher, rekindling memories of the brutal 2011… |
|
Heat and Drought Surge Once Again in Oklahoma
The drought plaguing much of the interior United States continues to stretch its tendrils into Oklahoma. Some experts claim the country’s current drought is the worst in… |
|
July Blazes to Sixth Warmest on Record as Drought ExpandsAugust 1, 2012 Heat exploded across Oklahoma during July thanks to a rapidly intensifying drought and a persistent upper-level ridge of high pressure. The combination of dry soils,… |
|
Extreme to Exceptional Drought Covers Most of Oklahoma
Spurred by the rapidly intensifying flash drought and its impacts, including the extreme fire danger realized in the state over the last week, the U.S. Drought Monitor… |
|
Drought and Wildfires Plague August
According to data from the Oklahoma Mesonet, August finished one degree above normal to rank as the 53rd warmest on record and a half an inch below… |
|
Late September Rains Provide Drought ReliefHopes for drought relief were starting to fade as September wound down, only to be saved by a slow-moving soaker of a storm system during the month’s last week.… |
|
October Interrupts Warm Streak, But Not Drought
It’s been awhile since Oklahoma has seen a month like October. Eleven months, to be exact. Not since September 2011 had Oklahoma seen a month where the… |
|
Oklahoma Drought Continues to Expand
With some areas of the state awaiting their first drop of rainfall since the end of September and a wheat crop left thirsting for water in powdery… |
|
Oklahoma Drought Picture Worsens During November
Oklahoma Drought Picture Worsens During November
Drought surged during November with a return to the dry, warm and windy weather pattern that Oklahoma has… |
|
Heat and Drought Dominate 2012 Oklahoma Weather Headlines
A slide back to true wintry weather, the likes of which had not been seen across Oklahoma since early February 2011, was not enough to prevent the… |
|
January Defies Dry TrendJanuary 31, 2013 January seemed destined to finish on the dry side of normal, just as the eight months previous to it had, before a late-month… |
|
February Brings Winter Storms, Drought Relief
February 28, 2013
Winter roared back into Oklahoma during February, providing significant drought relief to much of the state while dumping as much as… |
|
Arrival of Spring Fails to Rescue Dry March
April 1, 2013
The wet conditions of February failed to translate into March, but the cooler than normal weather continued virtually uninterrupted. According to… |
|
Science of Climate Change and Variability WorkshopOklahomas for Excellence in Science Education, the Oklahoma Climatological Survey, the National Science Foundation, and the University of Oklahoma Biological Survey will be hosting a climate workshop for teachers. … |
|
A May To Remember
In a state so accustomed to highly variable and often tumultuous weather, May 2013 will be long remembered as one of its most notorious. The month began… |
|
June Weather Follows ScriptJune followed its normal script almost to the letter with a rainy and stormy first half of the month that gave way to the beginnings of a long hot… |
|
An Uncommon July Brings Drought ReliefIt was not the wettest July on record in Oklahoma, at least not on a statewide basis. That mark belongs to 1950's statewide average of 9.26 inches. Nor was… |
|
Welcome to the new OK-First website!Today marks a new chapter for OK-First as we unveil a fresh, new website for our public safety partners participating in the OK-First program! The new website is now… |
|
National Weather Festival 2013
Saturday, Nov 2, 2013 |
|
Summer Returns During September, Brings Taste of FallAutumn returned to Oklahoma nearly right on cue during the last week of September thanks to a moisture-laden cold front. The temperatures got downright chilly with lows in the… |
|
November Brings Early Taste of Winter to OklahomaNovember is considered a fall month climatologically, but it certainly did its best to look like a winter month during 2013. Emphatically cooler than normal, thanks mostly to a… |
|
Frosty December Closes Out Tumultuous 2013
A frigid and sometimes icy December seemed a fitting way to close out the boisterous weather of 2013. Preliminary data from the Oklahoma Mesonet ranked the… |
|
Drought Grows Despite Recent RainsThe dust storms, wildfires and reports of struggling crops and pastures that have plagued the state over the last few weeks are evidence that drought has continued… |
|
Resurgent Spring Rains Continue in JuneAlthough the spring rainy season got a late start in 2014, not arriving in earnest until the third week of May, it continued with sustained vigor through the last… |
|
National Weather Festival 2014
Saturday, Nov 1, 2014 |
|
A July to RememberSometime around the third week of May, with wildfires scorching the state and drought continuing to intensify, Oklahomans were in search of a miracle. The spring rainy season at… |
|
Wx Briefing Ticker** Our Summer/Fall 2025 classes are now open for enrollment at https://learn.mesonet.org!** |
|
Summer Marks Return During AugustAugust made a valiant effort to continue the unusually cool and remarkably wet conditions of June and July and place a final exclamation point on one of the more… |
|
Dry September Diminishes Drought RecoveryHopes were high for much-needed rainfall across Oklahoma after August's disappointing totals. June and July were exceedingly wet, lending optimism that August's step back would be but a brief… |
|
October Rains Plentiful For Some, Scarce For OthersOne weekend of heavy rain brightened the fortunes of some Oklahomans during October while others continued on in the embrace of significant drought. Eastern Oklahoma, especially the far northeast… |
|
Local Media Thanks Mesonet for 20 Years of Great Work!This video is a compilation of on-air meteorologists talking about the Oklahoma Mesonet, how they use… |
|
Top 20 Extreme Weather Events in Mesonet HistorySince 1994 the Oklahoma Mesonet has recorded many extreme weather events throughout or state. We have made a website dedicated to showing you the top 20 most extreme events… |
|
November Snow Steals ShowOklahoma’s weather during November was both simplistic and momentous. It began and ended on the warm side, and had a good dose of January thrown in during the middle.… |
|
Spring 2015 OK-First Courses Open For EnrollmentIf you are a public safety official in the Mesonet's OK-First program, we've recently opened 10 classes for you for the spring 2015 training season! Here's what we're offering: … |
|
Winter Finally Finds DecemberWinter was noticeably absent through much of December, a deceptively warm month that ended more than 2 degrees above normal to rank as the 38th warmest since records began… |
|
The Two Faces of JanuaryThe old adage "numbers never lie" is a good principle in theory, but often dangerous if used within the context of Oklahoma's eccentric weather patterns. For example, the statewide… |
|
Winter Makes Presence Known During FebruaryThe first two weeks of February in Oklahoma were a nice preview of spring with temperatures rising at times into the 70s and 80s with just a few mildly… |
|
March Brings Severe Weather To OklahomaIt took nearly the entire month, but severe weather finally made a rather abrupt return to Oklahoma during the last week of March. Two separate storm systems brought severe… |
|
April Rains Hammer Oklahoma DroughtMired in significant drought for much of the last five years, western Oklahomans have been in desperate need of moisture. Mother Nature finally granted that wish and provided abundant… |
|
Fall 2015 OK-First Courses Now Open For EnrollmentIf you are a public safety official in the Mesonet's OK-First program or a new public safety official interested in joining us, we have recently opened enrollment… |
|
Historic May Rains Eliminate DroughtHistoric rains during May virtually eliminated the drought that had plagued Oklahoma for much of the past five years. The storms that brought that relief came with a cost,… |
|
The Tropics Bring Oklahoma Soggy JuneMother Nature turned off the spigot and cranked up the heat during the first 10 days of June, allowing swollen streams, rivers and reservoirs to slowly recede after the… |
|
Heavy Rain Continues Into JulyThe heavy rains of spring continued right through the first week of July before finally giving way to a more typical summertime pattern. Rainfall totals during July were particularly… |
|
Rainy Summer Evaporates In AugustMany a rainy summer has stared into the unyielding gaze of August and faltered. Coming off the wettest May-July period on record for Oklahoma, this August was met with… |
|
Drought Charges Ahead During SeptemberFlash drought continued to spread across southern Oklahoma during a dry, hot September, and had enveloped nearly 17 percent of the state by month’s end. According to preliminary data… |
|
Fall’s Delayed Arrival Also Brings Drought ReliefIt took a bit of convincing, but Mother Nature finally gave the okay for fall to arrive during the final week of October. That change in seasons took the… |
|
Spring 2016 OK-First Courses Now Open for EnrollmentIf you are a public safety official in the Mesonet's OK-First program or a new public safety official interested in joining us, we have recently opened enrollment… |
|
November Tornadoes, Ice Wreak Havoc Across OklahomaRecords were threatened, tornadoes were spotted, and ice crippled half of the state while the other half flooded, all thanks to two powerful storm systems during one of the… |
|
Oklahoma’s Historic 2015 Weather Ends With A BangMother Nature managed to save some of the worst of 2015’s weather for last, ending the year with a powerful winter storm that, while significant for western Oklahoma, was… |
|
El Niño’s Impacts Fizzle During JanuaryConsidering the extreme precipitation that ended 2015, and with the “super” El Niño that boosted the November-December period to the wettest on record for the state still in place,… |
|
The Winter That Never WasA warm, windy and dry February, plagued by wildfires, served as a fitting epitaph for a winter that largely failed to materialize. According to preliminary data from the Oklahoma… |
|
Shellberg Scholarship 2016In memory of David James Shellberg, the College of Atmospheric and Geographic Sciences will present a memorial scholarship to a student exhibiting exemplary vision focused on the utility of… |
|
Fire, Tornadoes Steal March Weather HeadlinesThe dry weather that had plagued the state during the first two months of 2016 continued during March. Drought conditions spread across nearly all of northwestern Oklahoma and aided… |
|
April Sees Active Weather IgniteFears of the strengthening drought and associated wildfire danger, so prevalent through the first three months of the year, lasted about a week into April before Mother Nature unleashed… |
|
Fall 2016 OK-First Courses Now Open for EnrollmentThe Oklahoma Mesonet has recently opened enrollment for 9 courses as part of our upcoming Fall 2016 OK-First class season! If you are currently an OK-First participant go… |
|
May Sees Numerous Severe Weather DaysKnown as the state’s most active severe weather month, May tried to live up to that moniker with several extended periods of threatening weather. Although it didn’t quite match… |
|
June Sees Drought’s ReturnLack of rain and hot weather took its toll during June, allowing drought to make a comeback from central through northeastern Oklahoma. Moisture deficits dating back to late April… |
|
Summer Sizzles During JulyThe state’s sizzling summer continued unabated through July, at least for most Oklahomans. The Oklahoma Mesonet recorded at least one triple-digit temperature in the state on 25 of the… |
|
August Provides Fall PreviewAutumn didn’t fully arrive during August, but it sure gave Oklahomans a nice preview for a week during the middle of the month. It was enough of a sneak… |
|
Uneven Rains Simplify Drought PictureAs a transition period between summer and fall, Mother Nature often provides Oklahoma with a wildly varying tale to tell during September. This year was no exception. At first… |
|
Spring 2017 OK-First Courses Now Open for EnrollmentSpring 2017 OK-First courses are now open for enrollment! We are offering 9 courses including a Certification course (4 days long), an Assistant Certification course (2 days long), and… |
|
October Roasts As Fall Remains AbsentAutumn remained a reluctant visitor during October as the jet stream retreated far to the north, leaving Oklahoma to bask in near summerlike heat. According to preliminary data from… |
|
Drought Accelerates In November HeatMother Nature did little during November to sooth those areas in Oklahoma most impacted by drought. Significant rains were scattered and temperatures were well above normal – as was… |
|
2016 Ends With Memorable DecemberDecember was a cold month for many Oklahomans, a dry month for most, and a memorable one for all. Normally, snow would be the big news during the first… |
|
Ice Storm Tops January Weather HeadlinesJanuary 2017 would have been remembered as exceedingly warm and dull if not for the visit from a powerful mid-month winter storm. The storm struck over the weekend of… |
|
February Brings Early Oklahoma SpringIf glimpses of winter were sporadic in December and January, they were downright scarce during February. Temperatures often soared into the 70s and 80s, culminating with a maximum of… |
|
March More Lion Than LambAlthough drought, severe storms and flooding rainfall all made their presence known during the month, March’s weather story was dominated by fire. Several months of elevated fire danger came… |
|
Fall 2017 Mesonet OK-First Classes Now Open for Enrollment
April Weather Runs the GamutApril took its penchant for widely varying weather to near satirical extremes across Oklahoma. Floods, tornadoes, drought and blizzards – Mother Nature pulled out all the stops to give… |
|
May Lives Up to BillingMay gets top billing as Oklahoma’s rowdiest weather month, and it certainly lived up to that notoriety this year. At least three major severe weather outbreaks occurred during May.… |
|
Drought Returns in JuneJune, normally a pillar of Oklahoma’s spring rainy season, was very much a disappointment in that regard. Unfortunately, that lack of significant moisture fueled a quick return to drought… |
|
July Follows Summer ScriptJuly followed Mother Nature’s customary script for mid-summer in Oklahoma, complete with long stretches of sun and scorching temperatures, wildly varying rainfall, and rapidly intensifying drought conditions. Rainfall fortunes… |
|
August Spurns SummerAugust is often Oklahoma’s most brutal summer month. The spring rains become a distant memory, heat gains momentum through July, and the state’s landscape turns a sickly shade of… |
|
Southeast Sees Driest September on RecordHot and dry weather dominated Oklahoma’s weather headlines for much of September, a drastic change from the extraordinarily mild and wet August the state had just experienced. Many wondered… |
|
Spring 2018 Mesonet OK-First Classes Now Open for EnrollmentSpring 2018 OK-First classes are now open for enrollment! We are offering 10 classes including 1 Certification class (4 days), 1 Assistant Certification… |
|
Tornadoes Highlight October WeatherOctober’s weather was highly variable, and a bit too exciting at times as is usually the case during this transition period from summer to winter. Temperatures ranged from the… |
|
Drought Expands During Dry November
Copyright © 1994-2025 Board of Regents of the University of Oklahoma. All Rights Reserved.
|