The Oklahoma Fire Danger Model is a useful tool that can be used to estimate current and future danger conditions across Oklahoma. As such it is useful for assessing general fire behavior characteristics of wildfires and prescribed burns. The adjective “general” is used, as the model was not developed for use on a field-by-field basis, as will be discussed later.
Output from the Oklahoma Fire Danger Model can be accessed via the OK-FIRE website.
Products are available in map, chart, and table formats for current conditions as well as for past and forecast time periods.
About the Oklahoma Fire Danger Model
Developed in the mid to late 1990s in conjunction with Bob Burgan and Larry Bradshaw of the Missoula Fire Sciences Laboratory, the Oklahoma Fire Danger Model was a prototype next-generation model of the US Forest Service’s National Fire Danger Rating System (NFDRS). It was the first such model to utilize a real-time automated statewide weather monitoring network, the Oklahoma Mesonet.
The Oklahoma Fire Danger Model is run every 15 minutes using weather data from the Oklahoma Mesonet and daily 500-m resolution VIIRS satellite imagery (NDVI) for assessment of surface greenness conditions, the latter of which is used to model live fuel moisture (herbaceous and woody) and to apportion the dynamic fuel load distribution between 1-hour dead fuels and live herbaceous and live deciduous woody fuels. In addition, 84-hour weather forecasts from the National Weather Service’s North American Mesoscale (NAM) model are integrated into the model. The NAM fire danger forecasts are updated every 6 hours, the frequency of NAM forecast updates.
Input to the Oklahoma Fire Danger Model includes observed Mesonet and NAM forecast weather data, daily 500-m resolution relative greenness data (calculated from the daily satellite data), a 500-m resolution Oklahoma NFDRS fuel model map, current and forecast dead fuel moisture from a calibrated version of the Nelson dead fuel moisture model, live fuel moisture calculated from the relative greenness data, and daily updated Keetch-Byram Drought Index (KBDI) values.
Output from the Oklahoma Fire Danger Model consists of the four NFDRS fire danger indices: Burning Index (BI), Spread Component (SC), Energy Release Component (ERC), and Ignition Component (IC).
Products are available in map, chart, and table formats. Color-coded maps to 500-m resolution are produced for the four NFDRS indices, as well as for the daily relative greenness, live herbaceous moisture, and live woody moisture. Other color-coded maps are produced for 1-, 10-, 100-, and 1000-hr dead fuel moisture and for KBDI. While the NFDRS maps are based on the fuel model distribution from the 500-m static Oklahoma fuel model map, OK-FIRE users can choose any of nine fuel models for any Mesonet site. The chart and table products for the four NFDRS indices for that specific site will then be calculated using the particular fuel model that the user has chosen.
Operational Products of the Oklahoma Fire Danger Model
Burning Index (BI)
This is probably the most useful index since it directly relates to the intensity of the fire (and thus is related to the difficulty of containment) and is scaled such that BI/10 is equal to the flame length (FL) in feet at the head of the fire. It is an index which integrates both the Spread Component (SC) and Energy Release Component (ERC). Figure 1 shows the calculated BI values on April 17, 2018.
The traditional U.S. Forest Service interpretation of Burning Index (BI) with respect to fire behavior
and suppression is listed below.
Burning Index (10*ft) | Flame Length (ft) | Fire Behavior and Suppression |
|---|---|---|
< 40 | < 4 | Fires can generally be attacked at the head or flanks by persons using hand tools. Hand line should hold the fire. |
40–80 | 4–8 | Fires are too intense for direct attack on the head by persons using hand tools. Hand line cannot be relied on to hold fire. Equipment such as dozers, pumpers, and retardant aircraft can be effective. |
80–110 | 8–11 | Fires may present serious control problems – torching out, crowning, and spotting. Control efforts at the fire head will probably be ineffective. |
> 110 | > 11 | Crowning, spotting, and major fire runs are probable. Control efforts at the head of the fire are ineffective. |
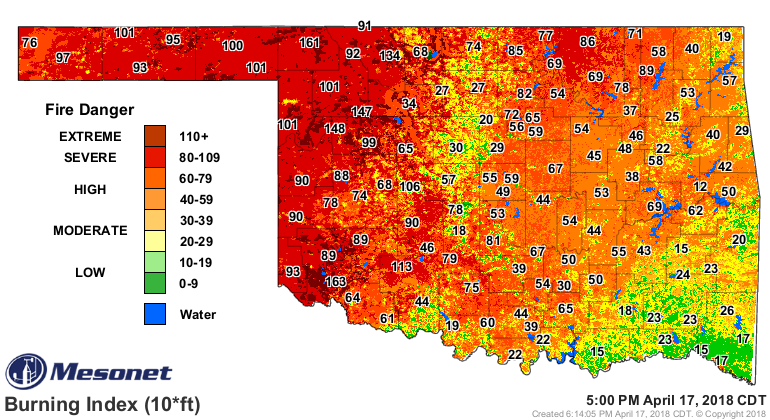
Burning Index is a function of the fuel model being used, the live and dead fuel loads, the live and dead fuel moistures, and the weather conditions. If the fuel types and loads are substantially different than those in the fuel model being used, there will be inaccuracies. It is also important to realize that these indices produced by the National Fire Danger Rating system are for the conditions modeled at 500-m resolution. In other words, because the fuel model represents the general fuel type over the entire 500-m pixel area, NFDRS indices such as BI are not meant to be used on a field-by-field basis. As an example, if the particular fuel in the area of concern (e.g., a particular field) differs from the assigned fuel model in that 500-m pixel, then the Oklahoma Fire Danger Model results for that pixel can be expected to be different than for the particular field in question (e.g., an open grassy area in a 500-m pixel that has been assigned a forest fuel model).
Spread Component (SC)
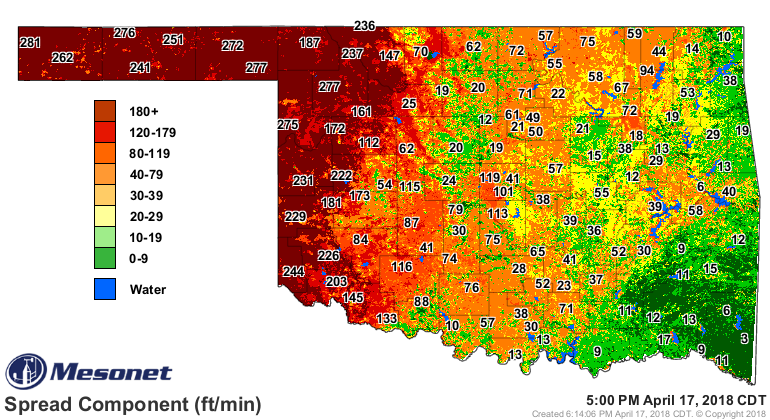
The Spread Component (SC) is numerically equal to the theoretical forward speed of the headfire in feet/minute. It is the most variable of the fire danger indices, with variations being caused by changes in wind speed and in moisture content of the live and dead fuels. Wind speed, slope and fine fuel moisture are key inputs in the calculation of the Spread Component, thus accounting for a high variability from day-to-day. Spread Component is a function of the fuel model being used, the live and dead fuel loads, the live and dead fuel moistures, and the weather conditions. If the fuel types and loads are substantially different than those in the fuel model being used, there will be inaccuracies. Figure 2 shows the calculated SC values on April 17, 2018.
Energy Release Component (ERC)
The Energy Release Component (ERC) is a measure of the available energy (BTU/square foot) released per unit area in the flaming zone at the head of the fire. It is the least variable of the indices on a day-to-day basis, being a function solely of the fuels. Conditions producing an ERC value of 24 represent a potential heat release twice that of conditions resulting in an ERC value of
12. Since ERC represents the potential heat release per unit area in the flaming zone, it can provide guidance to several important fire activities. It may also be considered a composite fuel moisture value as it reflects the contribution that all live and dead fuels have to potential fire intensity. Especially for fuel complexes containing the heavier 100- and 1000-hour fuels, the ERC is a
cumulative or build-up type of index. As live fuels cure and dead fuels dry, the ERC values get higher, thus providing a good reflection of drought conditions. ERC is a function of the fuel model being used, the live and dead fuel loads, and the live and dead fuel moistures. If the fuel types and loads are substantially different than those in the fuel model being used, there will be inaccuracies.
Ignition Component (IC)
The Ignition Component (IC) is equal to the probability (0-100%) of a firebrand producing a fire that will require suppression action. It says nothing about the intensity of the fire, which is indicated by the Burning Index (BI) value. An IC of 100% means that every firebrand will cause a fire requiring suppression action if it contacts a receptive fuel. Likewise an IC of 0% would mean that no firebrand would cause a fire requiring suppression action under those conditions. Note the emphasis is on action. The key is whether a fire will result that requires a fire manager to make a decision. The Ignition Component is more than the probability of a fire starting; it has to have the potential to spread. Therefore, Spread Component (SC) values enter into the calculation of IC. If a fire will ignite and spread, some action or decision is needed. Ignition Component is a function of the fuel model being used, the live and dead fuel loads, the live and dead fuel moistures, and the
weather conditions. If the fuel types and loads are substantially different than those in the fuel
model being used, there will be inaccuracies.
Keetch-Byram Drought Index (KBDI)
The Keetch-Byram Drought Index (KBDI) is a drought index utilized by the Oklahoma Fire Danger Model. Ranging from 0 to 800, the index is used in certain fuel models to increase the amount of dead fuel available to the fire. KBDI was included in the 1988 revisions to the National Fire Danger Rating System (NFDRS). KBDI values at Mesonet sites are updated daily at 4 p.m. CST.
Drought, as defined by KBDI, is a condition of dryness in the litter, duff, and upper soil layers that progresses from saturation to an absence of available moisture. KBDI is based on an arbitrary 8 inches of water in the litter/duff/soil column. When the column is completely saturated, KBDI = 0. As water is removed from the column by evapotranspiration, KBDI increases in value. When KBDI reaches 800 (its max), all the plant available water has been removed. In the Oklahoma Fire Danger Model, as KBDI increases above a value of 100, increasing amounts of dead fuel are provided for burning in most fuel models (exceptions are grassy Models A and L). During combustion some of this fuel contributes directly to fireline intensity (BI), but most increases total heat release (ERC) and contributes to burn severity through smoldering combustion.
In Oklahoma, KBDI has shown itself to be more useful during the growing season than during the dormant season. Also, as it was developed mainly for forested landscapes, its usefulness for grassy landscapes is somewhat questionable, which is why the drought fuel load was removed for Models A and L. KBDI values in the 600-800 range represent the most severe drought conditions, and many states issue burn bans at these levels. In forested areas, prescribed fires should not be conducted at values over 700, as fires will be intense and deep burning. The conditions described on the next page are based on experience within forested areas in the southeastern United States.
KBDI Value | Corresponding Conditions |
|---|---|
0-200 | Nearly all soil organic matter, duff and litter are left intact after a burn. Once the fire passes, remaining embers extinguish quickly and within a few minutes, the area is extinguished and smoke free. |
200-400 | Litter and duff layers begin to contribute to fire intensity. Heavier fuel classes can become involved. Soil exposure is minimal. Smoke management can become a real hazard, especially if there are larger fuels available. Smoldering with resulting smoke can continue into the night. |
400-600 | These levels represent the upper range at which most understory type burning should be conducted. Most of the duff and organic layers will ignite and actively burn. Considerable soil exposure occurs. The intensity can be expected to increase almost exponentially from the lower to upper ends of this range. Complete consumption of all but the largest dead fuels can be expected, and larger fuels not consumed may smolder for several days, leading to smoke and possible fire control problems. |
600-800 | These levels represent the most severe drought conditions, and many states issue burn bans at these levels. Prescribed fires should not be conducted at levels over 700. Fires that do occur will be intense and deep-burning. Live understory vegetation (2-3" diameter range) should be considered part of the fuel complex due to its low fuel moisture. Most subsurface soil organic matter will be consumed, and great soil exposure will occur with great future erosion potential. Smoldering may occur for many days, with smoke and fire control problems. |
Relative Greenness
An important input to the Oklahoma Fire Danger Model is a variable called Relative Greenness. Relative Greenness (RG) ranges from 0-100% and indicates how green each 500-m pixel of land is in relation to a 10+ year historical (2012-2022) database of greenness values for that particular pixel. An RG value of 100% signifies that this is the highest greenness level ever reached during the multi-year period, while an RG value of 0% indicates that this is the lowest greenness level reached over that same period. RG is calculated daily from a composite of NDVI data (Normalized Difference Vegetation Index) over the past 7 days using VIIRS satellite imagery; the highest NDVI value over the past 7 days is used in the composite. The calculation also involves a smoothing routine to filter out unrealistic daily rises and drops in greenness. If a given pixel is cloudy during the entire weekly period, the RG value used is taken from the last available valid value for that pixel. RG is a very important variable in the fire danger model used in OK-FIRE. It is used to model live fuel moisture (herbaceous and woody) and to apportion the fuel load distribution between 1-hour dead fuels and live herbaceous and live deciduous woody fuels.
Live Herbaceous Fuel Moisture
For those fuel models having an herbaceous fuel component, live herbaceous fuel moisture is another input to the Oklahoma Fire Danger Model. This variable represents the % moisture content on a dry-weight basis of live herbaceous fuels (e.g., grasses, forbs, ferns). In contrast to dead fuels, live herbaceous fuels have some greenness showing and moisture content is controlled largely by physiological processes within the plant (e.g., green-up in the spring, senescence in the fall). Most herbaceous fuels go through an annual cycle, at the end of which they convert to 1-hour dead fuels for purposes of fire danger modeling. During the growing season, low soil moisture can also cause these fuels to decrease in fuel moisture and convert to 1-hour dead fuels. Because live fuels consist mainly of water, fuel moisture values can get well over 100%. Live herbaceous moisture is updated daily with the new satellite information. It is modeled as a function of Relative Greenness for each 500-m pixel of land and can range from 0-200%. With the exception of Models B and K, all OK-FIRE fuel models have a live herbaceous fuel component.
Live Woody Fuel Moisture
For those fuel models having a woody fuel component, live woody fuel moisture is also another input to the Oklahoma Fire Danger Model. Live woody fuel moisture represents the % moisture content on a dry-weight basis of live woody fuels. Woody fuels are divided into evergreen and deciduous, and refer to the leaves, needles, and twigs of woody shrubs and trees. In contrast to dead fuels, live woody fuels contain some greenness and moisture content is controlled largely by physiological processes within the plant. Deciduous live woody fuels go through an annual cycle, at the end of which the leaves and twigs become 1-hour dead fuels for purposes of fire danger modeling. During the growing season, low soil moisture can cause these deciduous fuels to decrease in fuel moisture and convert to 1-hour dead fuels. Low soil moisture can cause evergreen fuels to decrease in fuel moisture anytime throughout the year. Live woody moisture is updated daily with the new satellite information. It is modeled as a function of Relative Greenness for each 500-m pixel of land and can range from 70-160%. With the exception of Models A, L, and K, all OK-FIRE fuel models have a woody fuel component.
1-Hour Dead Fuel Moisture
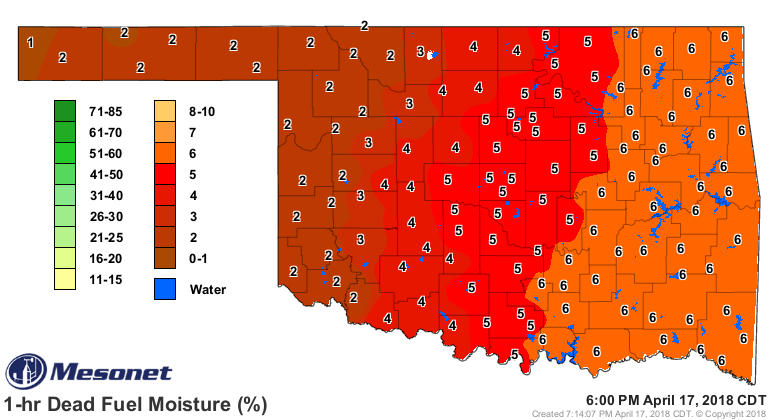
1-hour dead fuel moisture (DFM) is a critical input variable to the Oklahoma Fire Danger Model. 1-hour fuels are the fine dead fuels (< 0.25”) such as grasses which are often involved in the initiation and maintenance of wildland fires and whose moisture contents respond quickly (within minutes) to changing weather conditions. These dead fuels include herbaceous plants, roundwood, and also the uppermost layer (0.25”) of litter on the forest floor. 1-hour DFM is calculated by a calibrated version of the Nelson dead fuel moisture model and represents the % moisture content on a dry-weight basis of these size dead fuels. Values can range from 1% to 85%. For prescribed fire the preferred range of 1-hour dead fuel moisture is from 7 to 20%. Below values of 7%, spot fires become an increasing problem and above 20% there will be problems in starting and maintaining the fire due to too much moisture in the fine fuels. Using Mesonet data, 1-hour DFM is calculated every 15 minutes for all Mesonet site locations and interpolated to other 500-m pixels in the state. It is also calculated through the 84-hour forecast period using NAM forecast weather data. All OK-FIRE fuel models have 1-hour dead fuels.
10-Hour Dead Fuel Moisture
10-hour dead fuel moisture (DFM) is also another important input variable to the Oklahoma Fire Danger Model. Ten-hour fuels are the smaller diameter dead fuels in the 0.25" to 1" diameter range. They also respond quickly to changing weather conditions, but not as quickly as do 1-hour fuels. These fuels include roundwood and the layer of litter on forest floors extending, roughly, from 0.25" below the surface to 1" deep. 10-hour DFM is calculated by a calibrated version of the Nelson dead fuel moisture model and represents the % moisture content on a dry-weight basis of these size dead fuels. Values can range from 1% to 60%. For prescribed fire the preferred range of 10-hour dead fuel moisture is from 6 to 15%. Below values of 6%, spot fires become an increasing problem and above 15% there will be problems in starting and maintaining the fire due to too much moisture in the 10-hour fuels. Using Mesonet data, 10-hour DFM is calculated every 15 minutes for all Mesonet site locations and interpolated to other 500-m pixels in the state. It is also calculated through the 84-hour forecast period using NAM forecast weather data. With the exception of Models A and L, all OK-FIRE fuel models have 10-hour dead fuels.
100-Hour Dead Fuel Moisture
100-hour fuels include roundwood with diameters of 1-3" as well as organic materials beneath the surface at roughly 1-4" depths. 100-hour fuels respond more slowly than 10-hour fuels to changing weather conditions and are better indicators of extended dry or wet periods. Low 100-hr dead fuel moisture (DFM) during the growing season is often associated with increased summer wildfire activity. 100-hour DFM is calculated by a calibrated version of the Nelson dead fuel moisture model and represents the % moisture content on a dry-weight basis of these size dead fuels. Values can range from 1% to 40%. Using Mesonet data, 100-hour DFM is calculated every 15 minutes for all Mesonet site locations and interpolated to other 500-m pixels in the state. It is also
calculated through the 84-hour forecast period using NAM forecast weather data. With the exception of Models A, L, and T, all OK-FIRE fuel models have 100-hour dead fuels.
1000-Hour Dead Fuel Moisture
1000-hour fuels include roundwood with diameters of 3-8" as well as organic materials beneath the surface at roughly 4-12" depths. 1000-hour fuels respond more slowly than 100-hour fuels to changing weather conditions and are excellent indicators of extended dry or wet periods. Low 1000-hr dead fuel moisture (DFM) during the growing season is indicative of drought and usually associated with increased summer wildfire activity. 1000-hour DFM is calculated by a calibrated version of the Nelson dead fuel moisture model and represents the % moisture content on a dry-weight basis of these size dead fuels. Values can range from 1% to 32%. Using Mesonet data, 1000-hour DFM is calculated every 15 minutes for all Mesonet site locations and interpolated to other 500-m pixels in the state. It is also calculated through the 84-hour forecast period using NAM forecast weather data. Of all the OK-FIRE fuel models, only Models G and K have 1000-hour fuels.
Limitations of the Oklahoma Fire Danger Model
The Oklahoma Fire Danger (OKFD) Model, like the National Fire Danger Rating System, is a regional
fire danger assessment tool. It was not developed for use on a field-by-field basis. Some of the
limitations to understand before using the model are:
- Every 500-m “grid” square (or pixel) of land within Oklahoma has been assigned one of seven NFDRS fuel models (click on “Default Fuel Model Zoom Map” in the left menu section of OK-FIRE). These seven models are A, B, F, L, P, R, and T. If the particular fuel in the area of concern differs from the assigned fuel model (the “default” model) in that 500-m pixel, then the OKFD Model results for that pixel of land can be expected to be different than for the particular landscape in question (e.g., an open grassy area in a 500-m pixel that has been assigned a forest fuel model). However, OK-FIRE users have the option to choose any of nine fuel models for any Mesonet site. The chart and table products for the four NFDRS indices for that specific site will then be calculated using the particular fuel model that the user has chosen (and will continue to be based on that chosen fuel model until such time as the user changes it to a different one). The map products, however, for the four NFDRS indices will continue to be based on the fuel model distribution from the 500-m static Oklahoma default fuel model map.
- The OKFD Model assumes a terrain slope of 0-25%, so actual fire behavior over steeper terrain will be different than model predictions.
- The OKFD Model, like the NFDRS, applies only to surface fuels and thus does not model crown fires within forests.
- As has already been mentioned, the OKFD Model is not designed for specific fire behavior predictions for a given field, fuel type, slope, etc., but rather for the predominant vegetative fuel at scales of 500 meters and for mainly flat terrain. Remember that the default fuel model is used for maps of the four NFDRS indices but that the user can change the fuel model at specific Mesonet sites for charts and tables. OKFD Model output is also is based on the 500-m Relative Greenness (RG) value for the pixel (and any Mesonet station in that pixel is assigned that value). Thus, if the greenness levels of the landscape of concern differ from the RG value in that pixel or for that Mesonet site, the results will not be accurate and the user should choose a nearby Mesonet station (for chart and table products) that has a RG value more in line with the observed greenness (and also change the fuel model if needed at that nearby site).
- The NFDRS fuel models utilized in OK-FIRE were originally designed for wildland fuels (not for agricultural or urban areas). However, in order not to have data gaps in our NFDRS maps and no NFDRS data for chart/table products for Mesonet sites in these areas, we have in OK-FIRE assigned Model A to annual cropland and urban areas. Because of this, the OK-FIRE user should take heed that the fuel loads in such landscapes may be substantially different than Model A (e.g., no fuel loads in the case of bare fields or predominantly concrete urban areas, and, conversely, heavier fuel loads in the case of corn). This will cause OKFD Model output to be generally unreliable for annual cropland and urban areas.
- The OKFD Model will be unreliable for locations having a snow cover, especially when that snow completely covers the surface fuels. The model still “thinks” the fuel in the given fuel model is available for burning, even though the fuel may be completely covered by snow. After the snow cover melts, model output will become reliable once again.