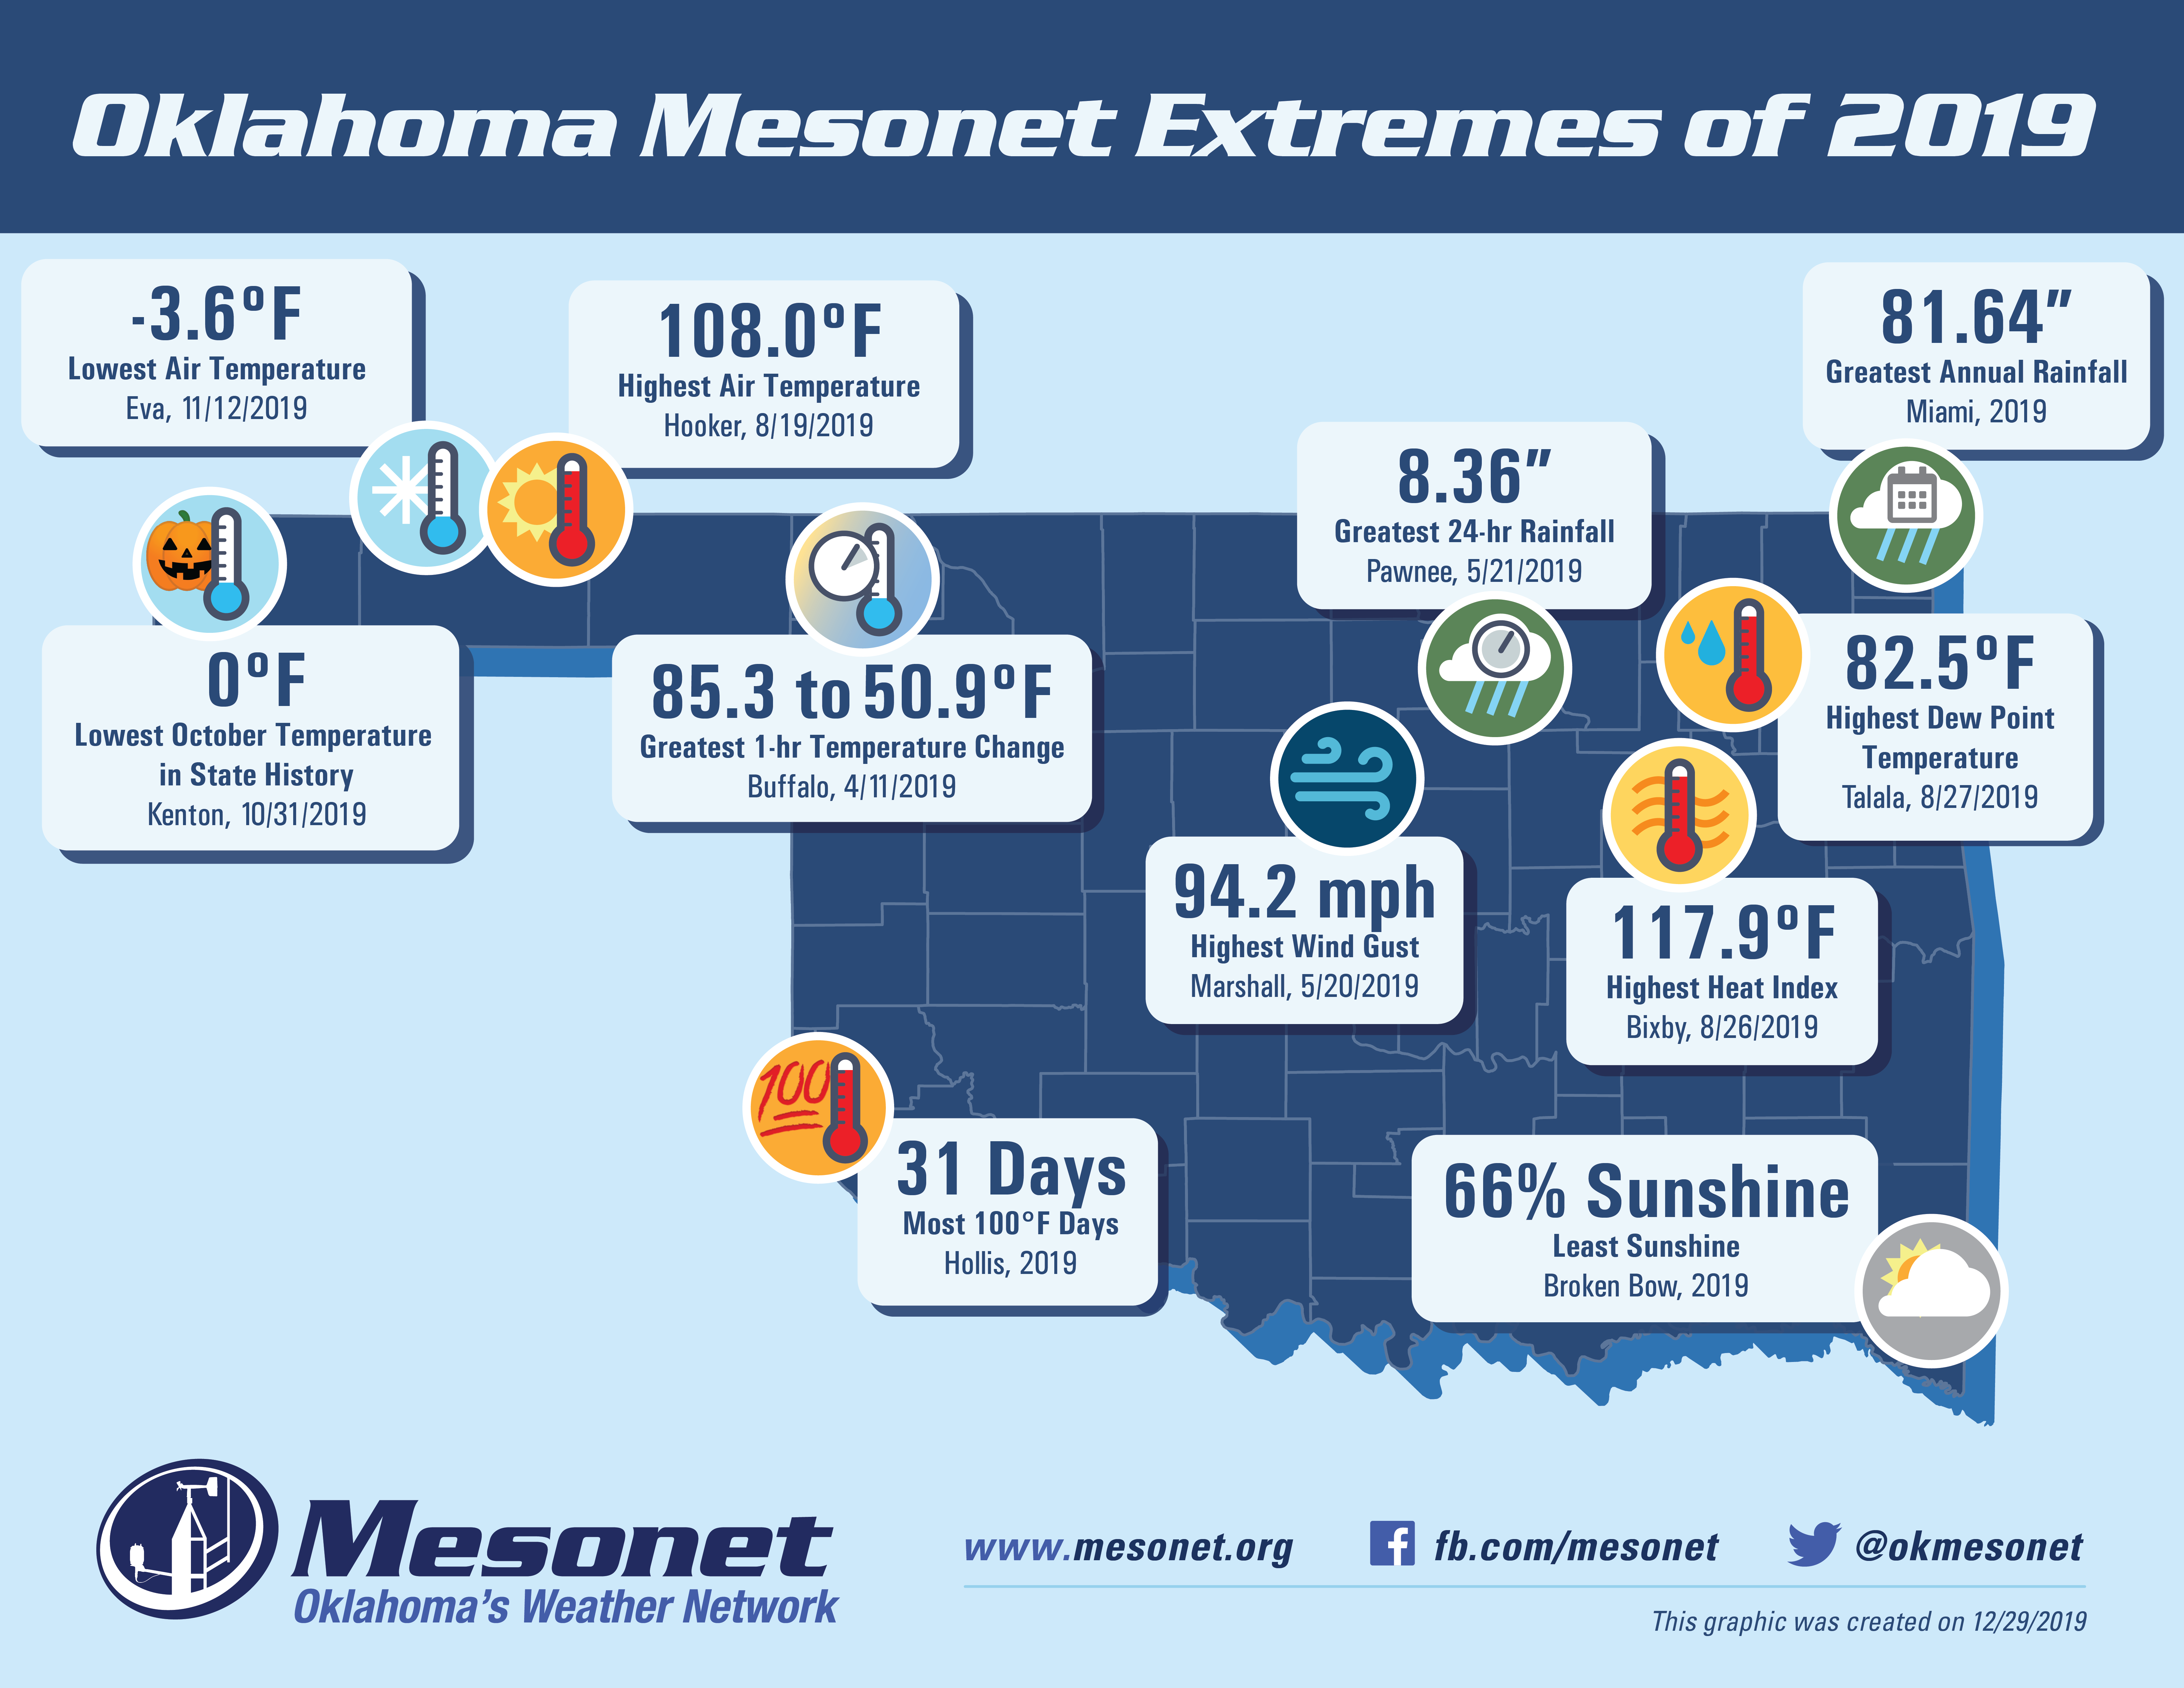
Each year the Oklahoma Mesonet creates a map showing the most extreme events that were recorded by the network throughout the year. In a year of wild weather, we identified 11 extremes that really stood out:
- Bixby - Highest Heat Index: 117.9°F on August 26
- Broken Bow - Least Sunshine: 66% Sunshine
- Buffalo - Greatest 1-hr Temperature Change: 85.3°F to 50.9°F on April 11
- Eva - Lowest Air Temperature: −3.6°F on November 12
- Hollis- Most 100°F Days: 31 days
- Hooker - Highest Air Temperature: 108.0°F on August 19
- Kenton - Lowest October Temperature in State History: 0°F on October 31
- Marshall - Highest Wind Gust: 94.2 mph on May 20
- Miami - Greatest Annual Rainfall: 81.64"
- Pawnee - Greatest 24-hr Rainfall: 8.36" on May 21
- Talala - Highest Dew Point Temperature: 82.5°F on August 27
This graphic was created on December 29, 2019.