Search Results for weather
Products
 |
WeatherScopeDescription***Note: The final version of WeatherScope was released on November 17, 2014. WeatherScope is no longer operationally supported by the Oklahoma Mesonet.*** Use our WeatherScope software to create interactive… |
 |
Current Fire Weather ConditionsThe Current Fire Weather Conditions map displays:
|
 |
National Fire Weather AdvisoriesThis map displays the latest fire advisories for the United States. It is updated as advisories are issued by the National Weather Service. |
 |
National Severe Weather AdvisoriesThis map displays the latest severe weather advisories for the United States. It is updated as advisories are issued by the National Weather Service. |
 |
Oklahoma Severe Weather AdvisoriesThis map displays the latest severe weather advisories for Oklahoma. It is updated as advisories are issued by the National Weather Service. |
Regional Weather Tables |
|
 |
6-hr Fire Weather Conditions ArchiveThis product shows a 6-hour archive of inversion and fire weather conditions maps at 15-minute intervals. The Fire Weather Conditions map displays:
|
 |
Oklahoma Fire Weather AdvisoriesThis map displays the latest fire advisories for Oklahoma. It is updated as advisories are issued by the National Weather Service. |
NWS Forecast TemperatureThe forecast temperature map plots the predicted air temperatures (degrees F) for Oklahoma. This map is updated periodically throughout the day. These forecasts are provided by the National Weather Service.… |
|
 |
US Seasonal Drought OutlookThe U.S. Seasonal Drought Outlook is produced by the National Weather Service's Climate Prediction Center. The outlook is updated every 2 weeks. |
 |
3-7 Day National Hazard OutlookThe 3-7 Day National Hazard Outlook is produced by the National Weather Service's Weather Prediction Center. |
 |
8-14 Day National Hazard OutlookThe 8-14 Day National Hazard Outlook is produced by the National Weather Service's Climate Prediction Center. |
 |
Day 1 Convective Storm OutlookThe day 1 severe weather outlook is issued by the National Weather Service's Storm Prediction Center. |
 |
Day 2 Convective Storm OutlookThe Day 2 severe weather outlook is issued by the National Weather Service's Storm Prediction Center. |
 |
Day 3 Convective Storm OutlookThe day 3 severe weather outlook is issued by the National Weather Service's Storm Prediction Center. |
 |
One Month Temperature OutlookThe One Month Temperature Outlook is produced by the National Weather Service's Climate Prediction Center. |
 |
One Month Precipitation OutlookThe One Month Precipitation Outlook is produced by the National Weather Service's Climate Prediction Center. |
 |
Three Month Temperature OutlookThe Three Month Temperature Outlook is produced by the National Weather Service's Climate Prediction Center. |
 |
Three Month Precipitation OutlookThe Three Month Precipitation Outlook is produced by the National Weather Service's Climate Prediction Center. |
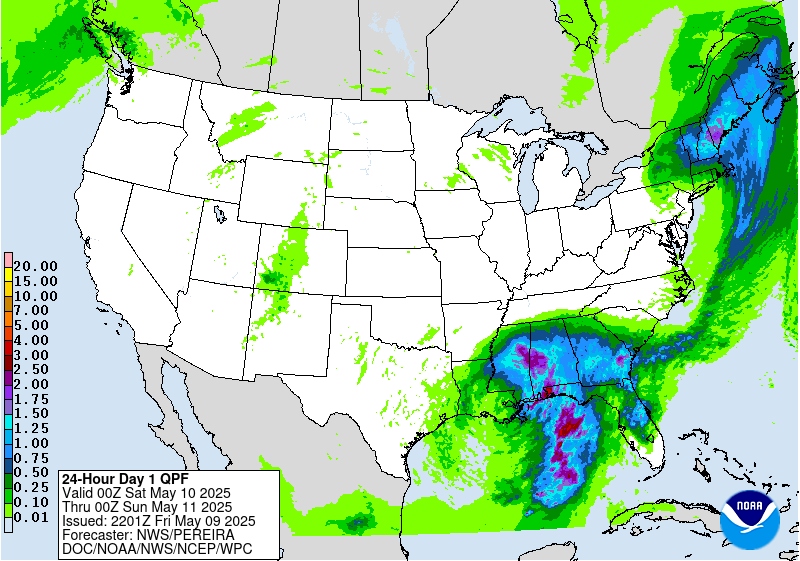 |
NWS Day 1 Precipitation ForecastThe Day 1 Precipitation Forecast is produced by the National Weather Service's Weather Prediction Center. |
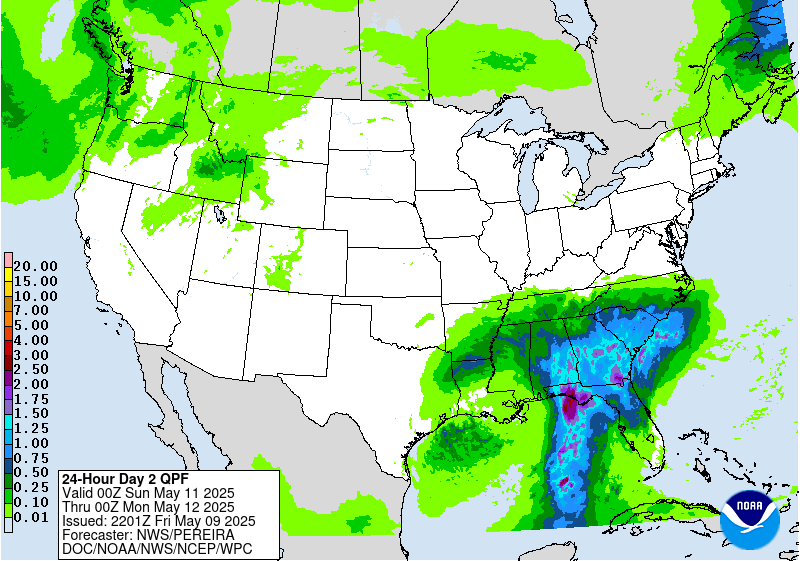 |
NWS Day 2 Precipitation ForecastThe Day 2 Precipitation Forecast is produced by the National Weather Service's Weather Prediction Center. |
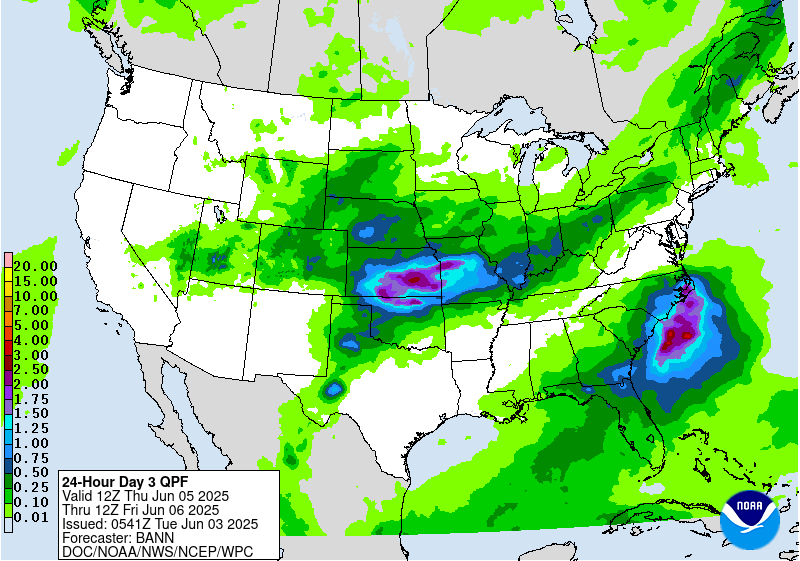 |
NWS Day 3 Precipitation ForecastThe Day 3 Precipitation Forecast is produced by the National Weather Service's Weather Prediction Center. |
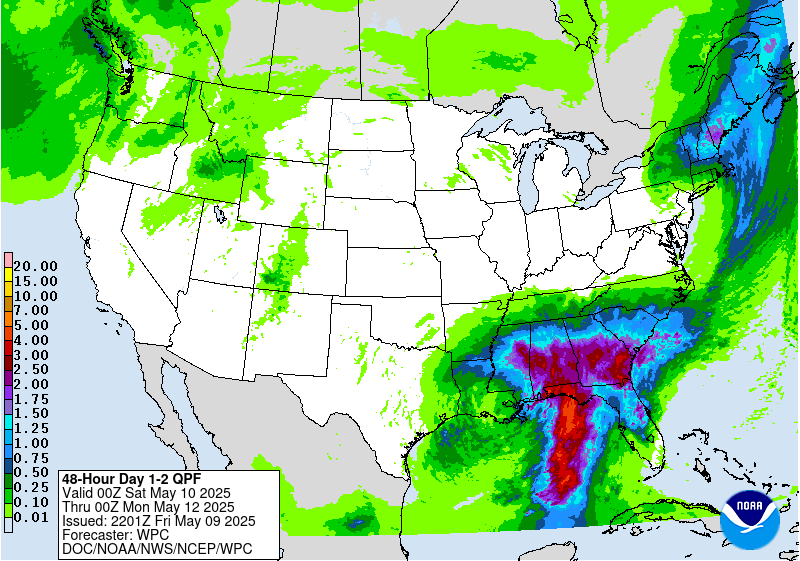 |
NWS Days 1-2 Precipitation ForecastThe Days 1-2 Precipitation Forecast is produced by the National Weather Service's Weather Prediction Center. |
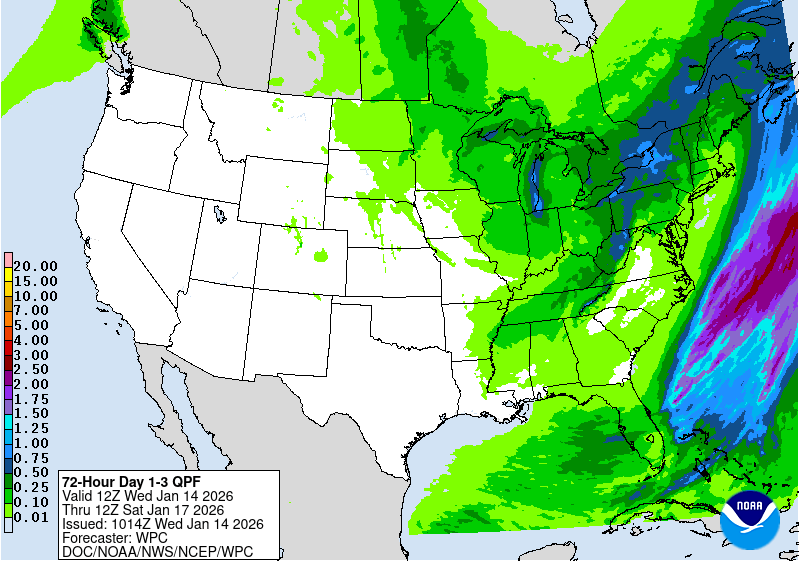 |
NWS Days 1-3 Precipitation ForecastThe Days 1-3 Precipitation Forecast is produced by the National Weather Service's Weather Prediction Center. |
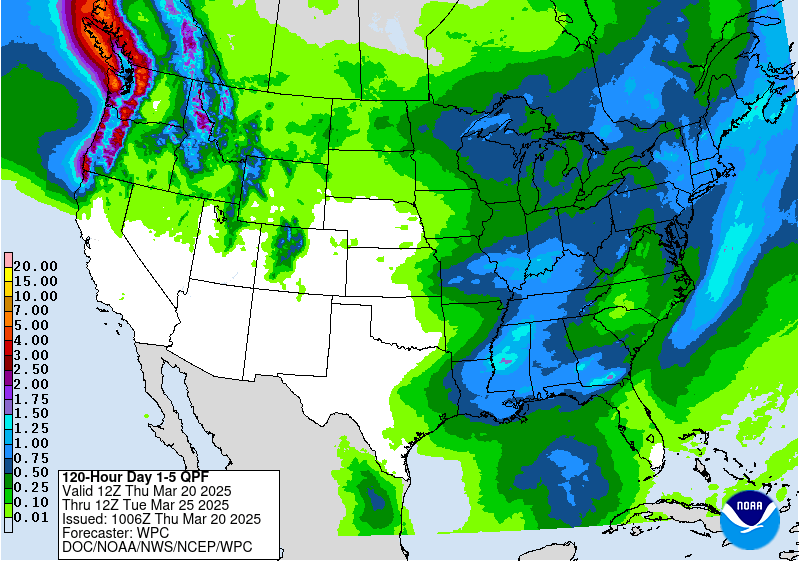 |
NWS Days 1-5 Precipitation ForecastThe Days 1-5 Precipitation Forecast is produced by the National Weather Service's Weather Prediction Center. |
 |
Day 1 Fire OutlookThe day 1 fire weather outlook is issued by the National Weather Service's Storm Prediction Center. |
 |
Day 2 Fire OutlookThe day 2 fire weather outlook is issued by the National Weather Service's Storm Prediction Center. |
 |
WPC Snow/Ice Forecast, Day 2The WPC Snow/Ice Forecast is produced by the NWS Weather Prediction Center. |
 |
WPC Snow/Ice Forecast, Day 3The WPC Snow/Ice Forecast is produced by the NWS Weather Prediction Center. |
 |
Day 1 Tornado OutlookThe Day 1 Tornado Outlook is issued by the National Weather Service's Storm Prediction Center. |
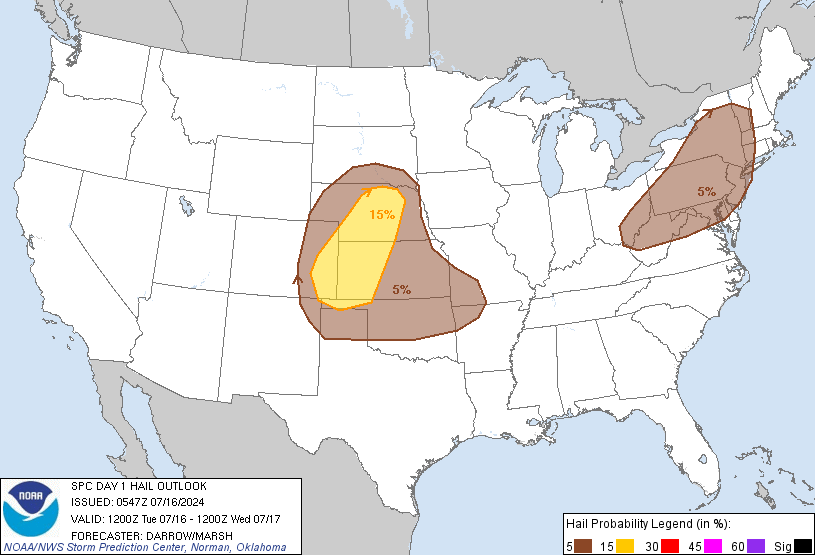 |
Day 1 Hail OutlookThe Day 1 Hail Outlook is issued by the National Weather Service's Storm Prediction Center. |
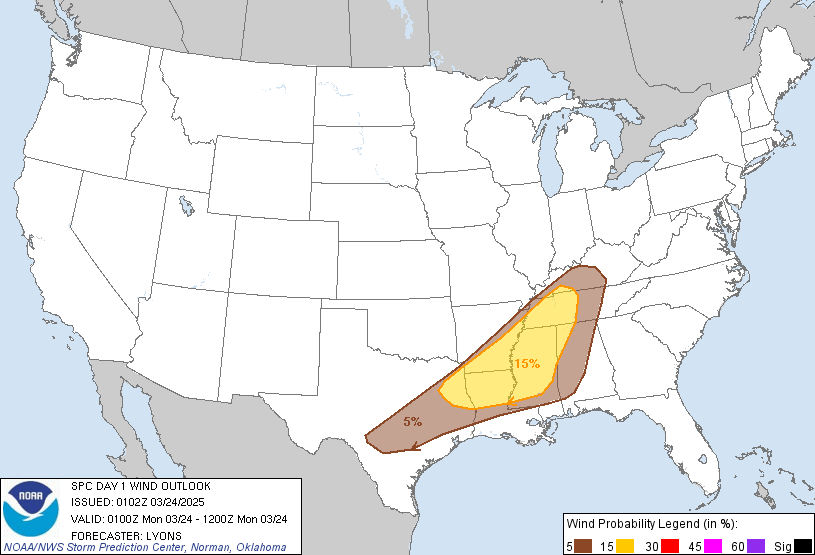 |
Day 1 Wind OutlookThe Day 1 Wind Outlook is issued by the National Weather Service's Storm Prediction Center. |
 |
Air TemperatureThe Air Temperature map plots the current air temperature (degrees F) at the standard height of 1.5 m (5 feet). When temperatures are below freezing, a line will delineate the… |
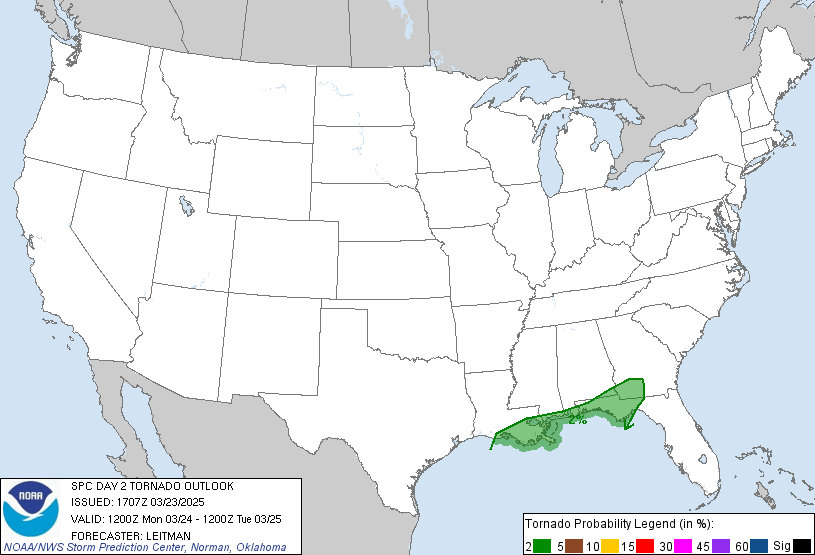 |
Day 2 Tornado OutlookThe Day 2 Tornado Outlook is issued by the National Weather Service's Storm Prediction Center. |
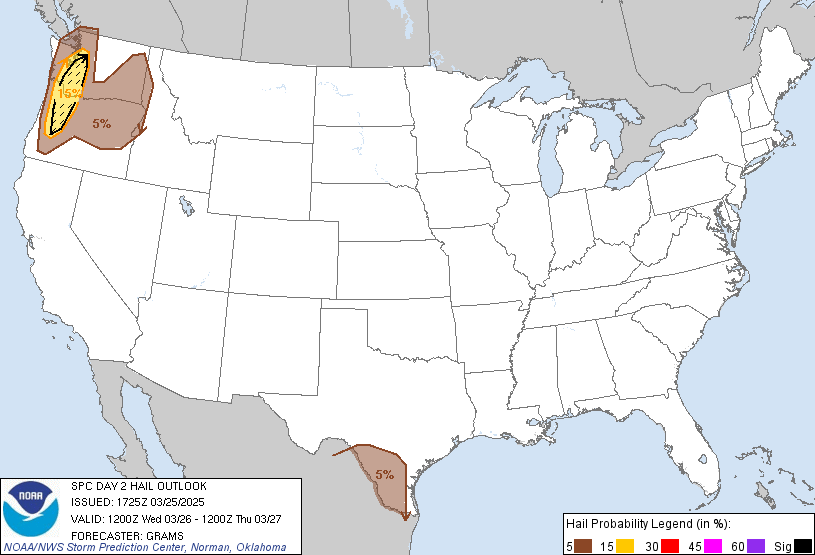 |
Day 2 Hail OutlookThe Day 2 Hail Outlook is issued by the National Weather Service's Storm Prediction Center. |
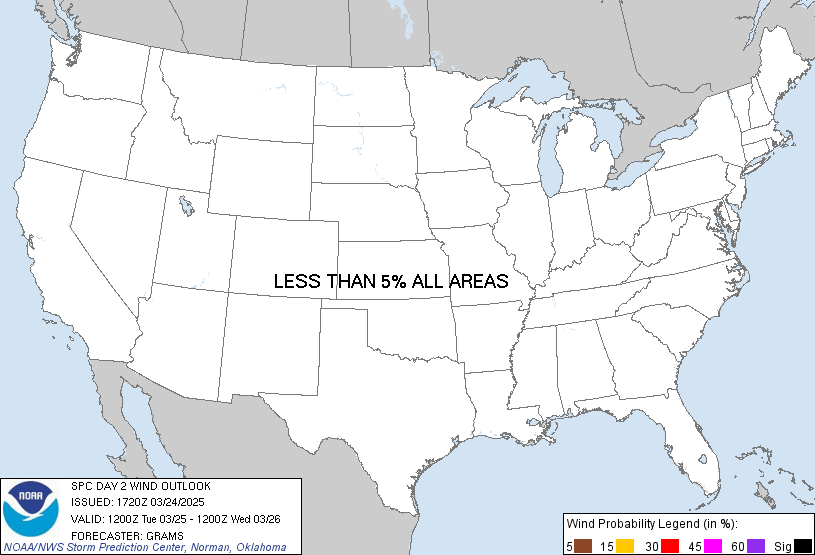 |
Day 2 Wind OutlookThe Day 2 Wind Outlook is issued by the National Weather Service's Storm Prediction Center. |
 |
Today's RainfallToday's Rainfall map displays accumulated rainfall observed at each Mesonet site since midnight. This map also displays the NWS Arkansas-Red Basin River Forecast Center's rainfall estimates (in color) across… |
 |
1-hour Rainfall AccumulationThe 1-hour Rainfall Accumulation map displays accumulated rainfall observed at each Mesonet site in the last hour. This map also displays the NWS Arkansas-Red Basin River Forecast Center's rainfall… |
 |
3-hour Rainfall AccumulationThe 3-hour Rainfall Accumulation map displays accumulated rainfall observed at each Mesonet site in the last 3 hours. This map also displays the NWS Arkansas-Red Basin River Forecast Center's… |
 |
6-hour Rainfall AccumulationThe 6-hour Rainfall Accumulation map displays accumulated rainfall observed at each Mesonet site in the last 6 hours. This map also displays the NWS Arkansas-Red Basin River Forecast Center's… |
 |
12-hour Rainfall AccumulationThe 12-hour Rainfall Accumulation map displays accumulated rainfall observed at each Mesonet site in the last 12 hours. This map also displays the NWS Arkansas-Red Basin River Forecast Center's… |
 |
24-hour Rainfall AccumulationThe 24-hour Rainfall Accumulation map displays accumulated rainfall observed at each Mesonet site in the last 24 hours. This map also displays the NWS Arkansas-Red Basin River Forecast Center's… |
 |
2-day Rainfall AccumulationThe 2-day Rainfall Accumulation map displays accumulated rainfall observed at each Mesonet site in the last 2 days. This map also displays the NWS Arkansas-Red Basin River Forecast Center's… |
 |
3-day Rainfall AccumulationThe 3-day Rainfall Accumulation map displays accumulated rainfall observed at each Mesonet site in the last 3 days. This map also displays the NWS Arkansas-Red Basin River Forecast Center's… |
 |
4-day Rainfall AccumulationThe 4-day Rainfall Accumulation map displays accumulated rainfall observed at each Mesonet site in the last 4 days. This map also displays the NWS Arkansas-Red Basin River Forecast Center's… |
 |
5-day Rainfall AccumulationThe 5-day Rainfall Accumulation map displays accumulated rainfall observed at each Mesonet site in the last 5 days. This map also displays the NWS Arkansas-Red Basin River Forecast Center's… |
 |
7-day Rainfall AccumulationThe 7-day Rainfall Accumulation map displays accumulated rainfall observed at each Mesonet site in the last 7 days. This map also displays the NWS Arkansas-Red Basin River Forecast Center's… |
 |
Mesonet Data FilesData files can be provided on request by contacting datarequest@mesonet.org. Service fees may apply. Mesonet MDF and MTS files are space delimited files used to display data… |
 |
10-day Rainfall AccumulationThe 10-day Rainfall Accumulation map displays accumulated rainfall observed at each Mesonet site in the last 10 days. This map also displays the NWS Arkansas-Red Basin River Forecast Center's… |
 |
30-day Rainfall AccumulationThe 30-day Rainfall Accumulation map displays accumulated rainfall observed at each Mesonet site in the last 30 days. This map also displays the NWS Arkansas-Red Basin River Forecast Center's… |
 |
Burning IndexThe Burning Index (BI) value (10*feet) as calculated by the Oklahoma Fire Danger Model. This is probably the most useful index of the National Fire Danger Rating System (on which… |
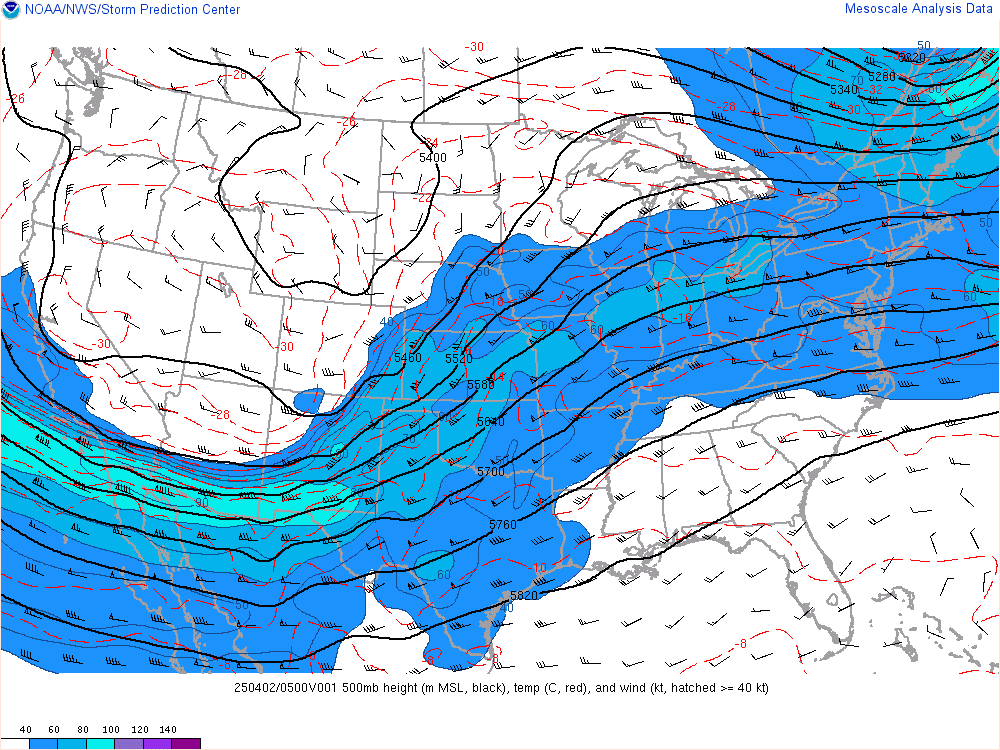 |
500 mb PlotThe 500 millibar (mb) map plots a variety of information collected by weather balloons and represents atmospheric conditions at an altitude of approximately 5500 meters (18,000 feet). The map displays… |
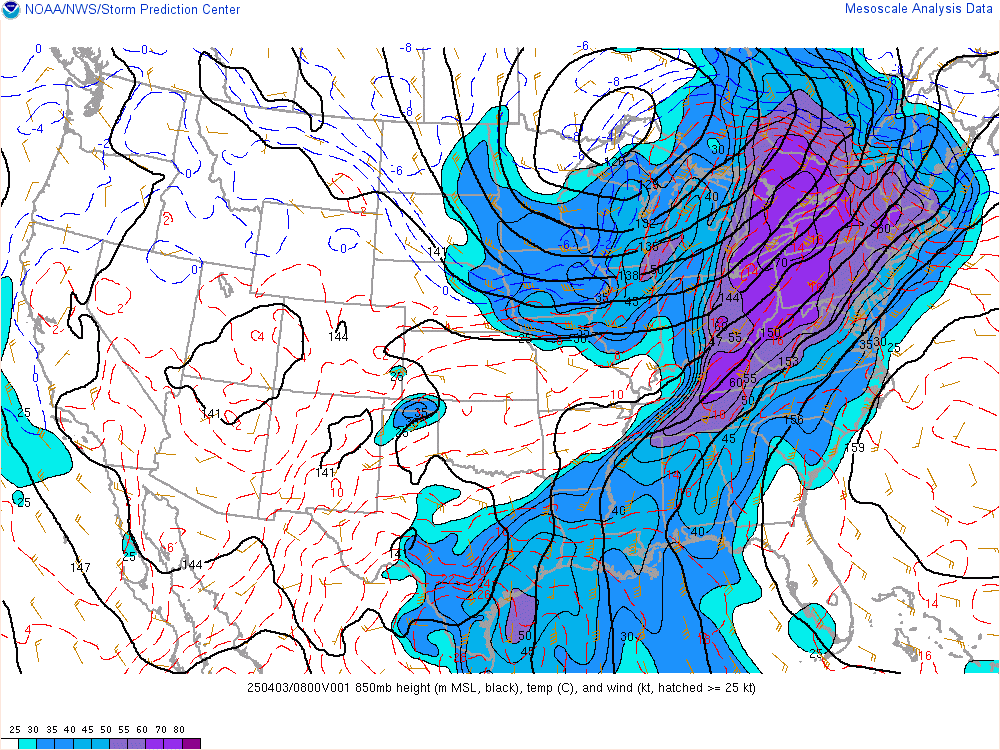 |
850 mb PlotThe 850 millibar (mb) map plots a variety of information collected by weather balloons and represents atmospheric conditions at an altitude of approximately 1500 meters (5,000 feet). The map displays… |
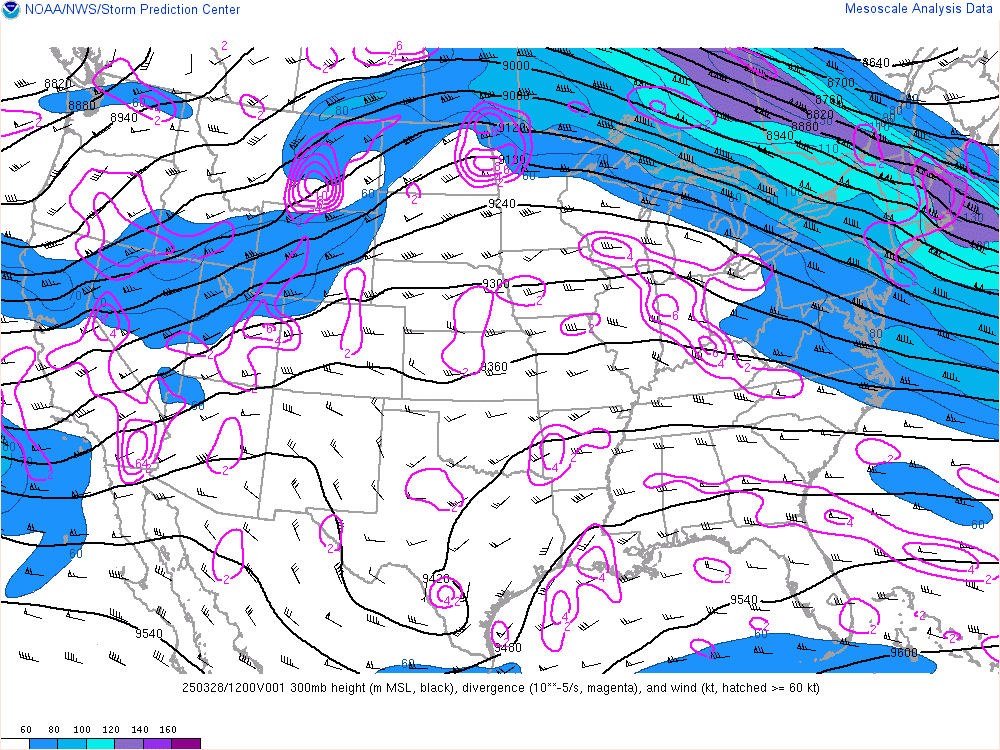 |
300 mb PlotThe 300 millibar (mb) map plots a variety of information collected by weather balloons and represents atmospheric conditions at an altitude of approximately 9300 meters (30,000 feet). The map displays… |
 |
National Air TemperatureThe Air Temperature map plots the current air temperature (degrees F) at the standard height of 1.5 m (5 feet). This map is updated every hour using data from NOAA's… |
 |
National Wind Chill / Heat IndexThis Wind Chill / Heat Index map plots either:
|
 |
National Altimeter SettingThis map is updated every hour using data from NOAA's National Weather Service. |
 |
National Dewpoint TemperatureThe Dewpoint Temperature map displays the current dewpoint temperature (degrees F) observed at each National Weather Service site. Dewpoint is the temperature to which air must be cooled for saturation… |
 |
National Relative HumidityThe Relative Humidity map displays the current relative humidity (%) at each National Weather Service site. Relative Humidity is the measure of the water vapor content of the air at… |
 |
National Wind SpeedThe WInd Speed map plots the current wind speeds (miles per hour) at the standard height of 10 m (30 feet). This map is updated every hour using data from… |
 |
National Flood AdvisoriesThis map displays the latest flood advisories for the United States. It is updated as advisories are issued by the National Weather Service. |
 |
National Frost/Freeze AdvisoriesThis map displays the latest frost and freeze advisories for the United States. It is updated as advisories are issued by the National Weather Service. |
 |
National Heat AdvisoriesThis map displays the latest heat advisories for the United States. It is updated as advisories are issued by the National Weather Service. |
 |
National High Wind AdvisoriesThis map displays the latest high wind advisories for the United States. It is updated as advisories are issued by the National Weather Service. |
 |
National Winter Storm AdvisoriesThis map displays the latest winter weather advisories for the United States. It is updated as advisories are issued by the National Weather Service. |
 |
National Ice AdvisoriesThis map displays the latest ice advisories for the United States. It is updated as advisories are issued by the National Weather Service. |
 |
Oklahoma Flood AdvisoriesThis map displays the latest flood advisories for Oklahoma. It is updated as advisories are issued by the National Weather Service. |
 |
Oklahoma High Wind AdvisoriesThis map displays the latest high wind advisories for Oklahoma. It is updated as advisories are issued by the National Weather Service. |
 |
Oklahoma Heat AdvisoriesThis map displays the latest heat advisories for Oklahoma. It is updated as advisories are issued by the National Weather Service. |
 |
Oklahoma Winter Storm AdvisoriesThis map displays the latest winter storm advisories for Oklahoma. It is updated as advisories are issued by the National Weather Service. |
 |
Oklahoma Frost/Freeze AdvisoriesThis map displays the latest frost and freeze advisories for Oklahoma. It is updated as advisories are issued by the National Weather Service. |
 |
Oklahoma Ice AdvisoriesThis map displays the latest ice advisories for Oklahoma. It is updated as advisories are issued by the National Weather Service. |
 |
Oklahoma Visibility AdvisoriesThis map displays the latest visibility advisories for Oklahoma. It is updated as advisories are issued by the National Weather Service. |
 |
National Visibility AdvisoriesThis map displays the latest visibility advisories for the United States. It is updated as advisories are issued by the National Weather Service. |
 |
National Ocean AdvisoriesThis map displays the latest advisories for the oceans around the United States. It is updated as advisories are issued by the National Weather Service. |
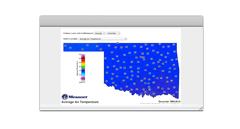 |
Mesonet Long-Term Averages - MapsThe Mesonet long-term averages utilize 15 years of daily data (e.g. daily average, daily maximum/minimum, or daily total) for every current and past Oklahoma Mesonet station. For a station's data… |
 |
6 to 10 Day Precipitation OutlookThe 6-10 day Outlook gives the confidence (probability) that the National Weather Service has that the observed total precipitation, averaged over upcoming days 6, 7, 8, 9 and 10 will… |
 |
6 to 10 Day Temperature OutlookThe 6-10 day Outlook gives the confidence (probability) that the National Weather Service has that the observed temperature, averaged over upcoming days 6, 7, 8, 9 and 10 will be… |
 |
8 to 14 Day Precipitation OutlookThe 8-14 day Outlook gives the confidence (probability) that the National Weather Service has that the observed total precipitation, averaged over upcoming days 8, 9, 10 , 11, 12, 13,… |
 |
8 to 14 Day Temperature OutlookThe 8-14 day Outlook gives the confidence (probability) that the National Weather Service has that the observed temperature, averaged over upcoming days 8, 9, 10, 11, 12, 13, and 14… |
 |
WPC Snow/Ice Forecast, Day 1The WPC Snow/Ice Forecast is produced by the NWS Weather Prediction Center. |
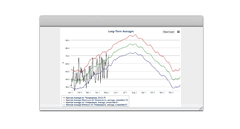 |
Mesonet Long-Term Averages - GraphsThe Mesonet long-term averages utilize 15 years of daily data (e.g. daily average, daily maximum/minimum, or daily total) for every current and past Oklahoma Mesonet station. For a station's data… |
 |
U.S. Monthly Drought OutlookThe U.S. Monthly Drought Outlook is produced by the National Weather Service's Climate Prediction Center. The outlook is updated every 2 weeks. |
 |
60-day Rainfall AccumulationThe 60-day Rainfall Accumulation map displays accumulated rainfall observed at each Mesonet site in the last 60 days. This map also displays the NWS Arkansas-Red Basin River Forecast Center's… |
 |
90-day Rainfall AccumulationThe 90-day Rainfall Accumulation map displays accumulated rainfall observed at each Mesonet site in the last 90 days. This map also displays the NWS Arkansas-Red Basin River Forecast Center's… |
 |
120-day Rainfall AccumulationThe 120-day Rainfall Accumulation map displays accumulated rainfall observed at each Mesonet site in the last 120 days. This map also displays the NWS Arkansas-Red Basin River Forecast Center's… |
 |
180-day Rainfall AccumulationThe 180-day Rainfall Accumulation map displays accumulated rainfall observed at each Mesonet site in the last 180 days. This map also displays the NWS Arkansas-Red Basin River Forecast Center's… |
 |
365-day Rainfall AccumulationThe 365-day Rainfall Accumulation map displays accumulated rainfall observed at each Mesonet site in the last 365 days. This map also displays the NWS Arkansas-Red Basin River Forecast Center's… |
 |
14-day Rainfall AccumulationThe 14-day Rainfall Accumulation map displays accumulated rainfall observed at each Mesonet site in the last hour. This map also displays the NWS Arkansas-Red Basin River Forecast Center's rainfall… |
 |
Wet Bulb Globe Temperature RiskThe Wet Bulb Globe Temperature Risk map plots the current wet bulb globe temperature (degrees F) at the standard height of 1.5m (5 feet) along with its associated risk category.… |
 |
Today's Maximum Wet Bulb Globe Temperature RiskThe Today's Maximum Wet Bulb Globe Temperature Risk map plots the maximum wet bulb globe temperatures (degrees F) at the standard height of 1.5m (5 feet) along with its associated… |
 |
Yesterday's Maximum Wet Bulb Globe Temperature RiskThe Yesterday's Maximum Wet Bulb Globe Temperature Risk map plots the maximum wet bulb globe temperatures (degrees F) at the standard height of 1.5m (5 feet) along with its associated… |
 |
Relative Humidity and WindsThe Relative Humidity and Winds map displays the current relative humidity at 1.5 m (5 ft), displayed in percent (%), at each Mesonet site, as well as the 10-m average… |
 |
Spread ComponentThe Spread Component (SC) is numerically equal to the theoretical forward speed of the headfire in feet/minute. It is the most variable of the fire danger indices, with variations being… |
 |
Ignition ComponentThe Ignition Component (IC) is equal to the probability (0-100%) of a firebrand producing a fire that will require suppression action. It says nothing about the intensity of the fire,… |
 |
1-hr Dead Fuel MoistureThe 1-hr Dead Fuel Moisture map displays the % moisture content (dry-weight basis) of 1-hour dead fuels as calculated by a calibrated version of the Nelson dead fuel moisture model.… |
 |
10-hr Dead Fuel MoistureThe 10-hr Dead Fuel Moisture map displays the % moisture content (dry-weight basis) of 10-hour dead fuels as calculated by a calibrated version of the Nelson dead fuel moisture model.… |
 |
100-hr Dead Fuel MoistureThe 100-hr Dead Fuel Moisture map displays the % moisture content (dry-weight basis) of 100-hour dead fuels as calculated by a calibrated version of the Nelson dead fuel moisture model.… |
 |
1000-hr Dead Fuel MoistureThe 1000-hr Dead Fuel Moisture map displays the % moisture content (dry-weight basis) of 1000-hour dead fuels as calculated by a calibrated version of the Nelson dead fuel moisture model.… |
 |
16-inch % Plant Available Soil MoisturePlotted values depict the percent of maximum plant available soil moisture currently in the top 16" of the soil profile. In the growing season (May through October), values <= 20%… |
 |
Regional 3.9 micron InfraredThis satellite image displays the shortwave infrared wavelength band (band 7) from the GOES-16 satellite. This is a particular wavelength band (centered at 3.9 microns) that is very useful for… |
 |
Oklahoma Water VaporThis satellite image displays the lower-level water vapor wavelength band (band 10) of the three water vapor bands from the GOES-16 satellite. The water vapor depicted by this particular band… |
 |
Regional Water VaporThis satellite image displays the lower-level water vapor wavelength band (band 10) of the three water vapor bands from the GOES-16 satellite. The water vapor depicted by this particular band… |
 |
Oklahoma 3.9 micron Infrared SatelliteThis satellite image displays the shortwave infrared wavelength band (band 7) from the GOES-16 satellite. This is a particular wavelength band (centered at 3.9 microns) that is very useful for… |
 |
Oklahoma West 3.9 micron InfraredThis satellite image displays the shortwave infrared wavelength band (band 7) from the GOES-16 satellite. This is a particular wavelength band (centered at 3.9 microns) that is very useful for… |
 |
Oklahoma East 3.9 micron InfraredThis satellite image displays the shortwave infrared wavelength band (band 7) from the GOES-16 satellite. This is a particular wavelength band (centered at 3.9 microns) that is very useful for… |
 |
Oklahoma Visible (Blue)This satellite image displays the "blue" wavelength band (band 1), one of two visible bands from the GOES-16 satellite. During the daytime this map is particularly useful for seeing smoke… |
 |
Oklahoma West Visible (Blue)This satellite image displays the "blue" wavelength band (band 1), one of two visible bands from the GOES-16 satellite. During the daytime this map is particularly useful for seeing smoke… |
 |
Oklahoma East Visible (Blue)This satellite image displays the "blue" wavelength band (band 1), one of two visible bands from the GOES-16 satellite. During the daytime this map is particularly useful for seeing smoke… |
 |
Oklahoma Visible (Red)This satellite image displays the"red" wavelength band (band 2), one of two visible bands from the GOES-16 satellite. During the daytime this map is particularly useful for seeing surface features… |
 |
Oklahoma West Visible (Red)This satellite image displays the "red" wavelength band (band 2), one of two visible bands from the GOES-16 satellite. During the daytime this map is particularly useful for seeing surface… |
 |
Oklahoma East Visible (Red)This satellite image displays the "red" wavelength band (band 2), one of two visible bands from the GOES-16 satellite. During the daytime this map is particularly useful for seeing surface… |
 |
Oklahoma West Water VaporThis satellite image displays the lower-level water vapor wavelength band (band 10) of the three water vapor bands from the GOES-16 satellite. The water vapor depicted by this particular band… |
 |
Oklahoma East Water VaporThis satellite image displays the lower-level water vapor wavelength band (band 10) of the three water vapor bands from the GOES-16 satellite. The water vapor depicted by this particular band… |
 |
Regional Visible (Blue)This satellite image displays the "blue" wavelength band (band 1), one of two visible bands from the GOES-16 satellite. During the daytime this map is particularly useful for seeing smoke… |
 |
Regional Visible (Red)This satellite image displays the "red" wavelength band (band 2), one of two visible bands from the GOES-16 satellite. During the daytime this map is particularly useful for seeing surface… |
 |
AmarilloThis radar image from Amarillo shows the current base reflectivity at a 0.5 degree upward tilt of the radar beam. Local radar can be useful, as can satellite imagery in… |
 |
Oklahoma CityThis radar image from Oklahoma City shows the current base reflectivity at a 0.5 degree upward tilt of the radar beam. Local radar can be useful, as can satellite imagery… |
 |
TulsaThis radar image from Tulsa shows the current base reflectivity at a 0.5 degree upward tilt of the radar beam. Local radar can be useful, as can satellite imagery in… |
 |
Dodge CityThis radar image from Dodge City shows the current base reflectivity at a 0.5 degree upward tilt of the radar beam. Local radar can be useful, as can satellite imagery… |
 |
Vance AFBThis radar image from Vance Air Force Base shows the current base reflectivity at a 0.5 degree upward tilt of the radar beam. Local radar can be useful, as can… |
 |
WichitaThis radar image from Wichita shows the current base reflectivity at a 0.5 degree upward tilt of the radar beam. Local radar can be useful, as can satellite imagery in… |
 |
FrederickThis radar image from Frederick shows the current base reflectivity at a 0.5 degree upward tilt of the radar beam. Local radar can be useful, as can satellite imagery in… |
 |
Fort SmithThis radar image from Fort Smith shows the current base reflectivity at a 0.5 degree upward tilt of the radar beam. Local radar can be useful, as can satellite imagery… |
 |
Dallas - Fort WorthThis radar image from Dallas/Fort Worth shows the current base reflectivity at a 0.5 degree upward tilt of the radar beam. Local radar can be useful, as can satellite imagery… |
Web Site
October’s Weather Warm and Dry, Could Continue Through Rest of 2010October’s Weather Warm and Dry, Could Continue Through Rest of 2010 Dry and warm conditions continued over much of… |
|
February Weather Full of Extremes, and RecordsFebruary Weather Full of Extremes, and Records In a state accustomed to extreme weather, February was a bit startling… |
|
Tornadoes Top Weather Story During MayTornadoes Top Weather Story During May Gary McManus Associate State Climatologist Oklahoma Climatological Survey
Even though severe weather only struck on a few… |
|
EarthStorm - National Weather Festival 2011
Heat and Drought Dominate 2012 Oklahoma Weather Headlines
A slide back to true wintry weather, the likes of which had not been seen across Oklahoma since early February 2011, was not enough to prevent the… |
|
June Weather Follows ScriptJune followed its normal script almost to the letter with a rainy and stormy first half of the month that gave way to the beginnings of a long hot… |
|
National Weather Festival 2013
Saturday, Nov 2, 2013 |
|
National Weather Festival 2014
Saturday, Nov 1, 2014 |
|
Top 20 Extreme Weather Events in Mesonet HistorySince 1994 the Oklahoma Mesonet has recorded many extreme weather events throughout or state. We have made a website dedicated to showing you the top 20 most extreme events… |
|
March Brings Severe Weather To OklahomaIt took nearly the entire month, but severe weather finally made a rather abrupt return to Oklahoma during the last week of March. Two separate storm systems brought severe… |
|
Oklahoma’s Historic 2015 Weather Ends With A BangMother Nature managed to save some of the worst of 2015’s weather for last, ending the year with a powerful winter storm that, while significant for western Oklahoma, was… |
|
Fire, Tornadoes Steal March Weather HeadlinesThe dry weather that had plagued the state during the first two months of 2016 continued during March. Drought conditions spread across nearly all of northwestern Oklahoma and aided… |
|
April Sees Active Weather IgniteFears of the strengthening drought and associated wildfire danger, so prevalent through the first three months of the year, lasted about a week into April before Mother Nature unleashed… |
|
May Sees Numerous Severe Weather DaysKnown as the state’s most active severe weather month, May tried to live up to that moniker with several extended periods of threatening weather. Although it didn’t quite match… |
|
Ice Storm Tops January Weather HeadlinesJanuary 2017 would have been remembered as exceedingly warm and dull if not for the visit from a powerful mid-month winter storm. The storm struck over the weekend of… |
|
April Weather Runs the GamutApril took its penchant for widely varying weather to near satirical extremes across Oklahoma. Floods, tornadoes, drought and blizzards – Mother Nature pulled out all the stops to give… |
|
Tornadoes Highlight October WeatherOctober’s weather was highly variable, and a bit too exciting at times as is usually the case during this transition period from summer to winter. Temperatures ranged from the… |
|
November’s Eventful Weather
Copyright © 1994-2025 Board of Regents of the University of Oklahoma. All Rights Reserved.
|