Skip to main content
Main navigation
Weather
Forecast
Past Data
Drought
Agriculture
K-20 Education
Fire Management
Public Safety
Research
Overview
Research Team and Partners
Research Datasets
Past Projects
Research Publications
About
Overview
History
Mesonet Benefits
Mesonet Sites
Instruments
Data Descriptions
Data Access and Pricing
Terms of Use
More
News
Steering Committee
Quality Assurance
Widgets
Oklahoma Climatological Survey
Contact
It looks like you might have accessed this page from an outdated address. Please update bookmarks and links to:
Home
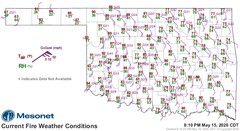
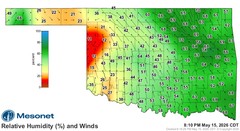
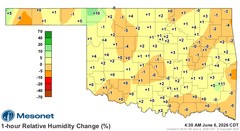
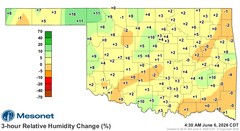
OK-FIRE
Current Maps
Fire Weather
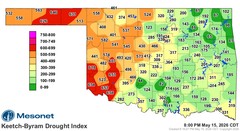
Fire Danger
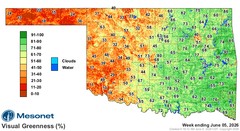
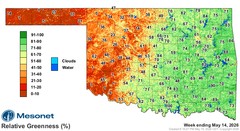
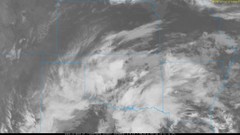
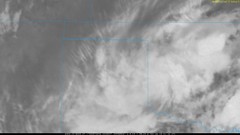
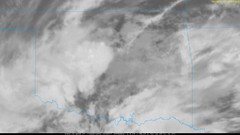
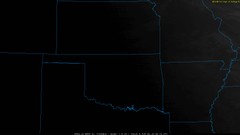
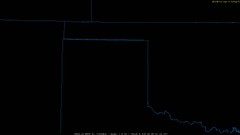
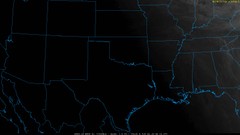
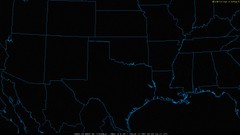
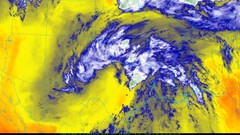
Satellite
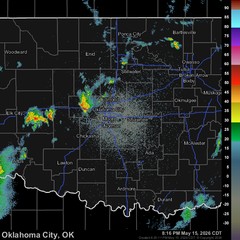
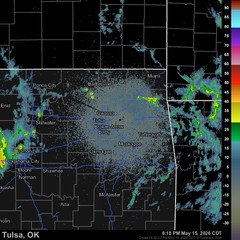
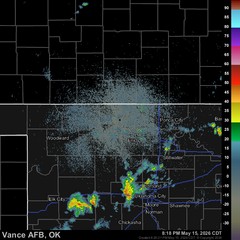
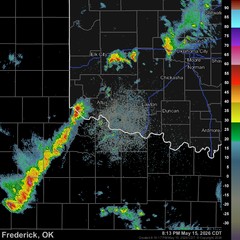
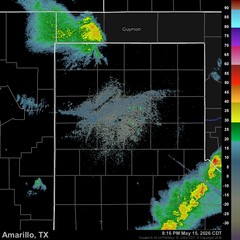
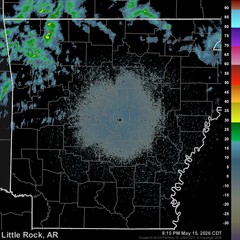
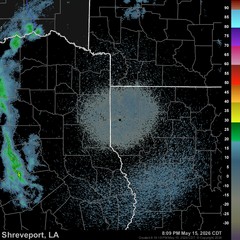
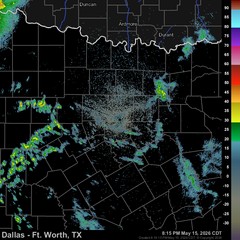
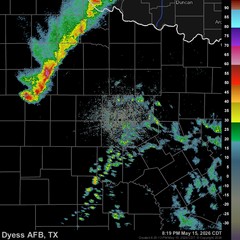
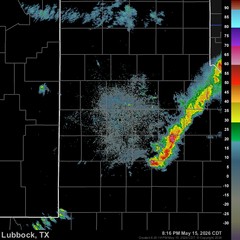
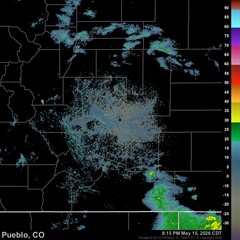
Local Radars